SLI Configuration
A Service Level Indicator (SLI) is an automated measurement that runs on a schedule. Each SLI executes a script (via a CodeBundle) that returns a numeric metric, which is stored and evaluated for alerting.
Managing SLIs in the UI
SLIs are configured as part of an SLX in Workspace Studio > Tasks. Open the SLX Preview (eye icon) and select the Health tab to see live SLI data.
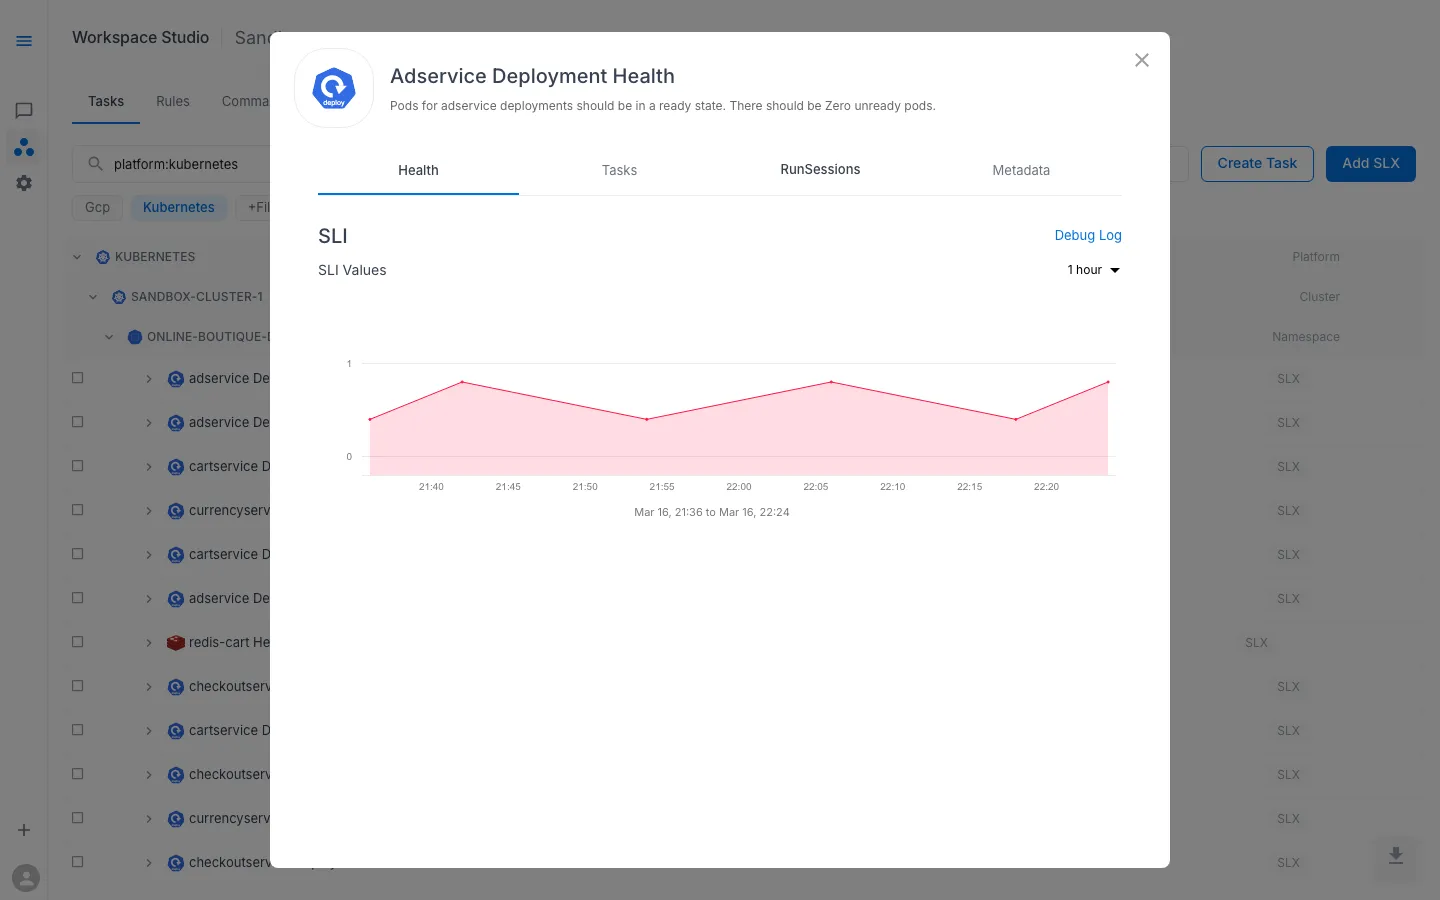
The Health tab displays:
- SLI Values — a time-series chart of the metric, with a configurable time range (1 hour, 6 hours, 24 hours, etc.)
- Debug Log — link to the raw SLI execution log for troubleshooting
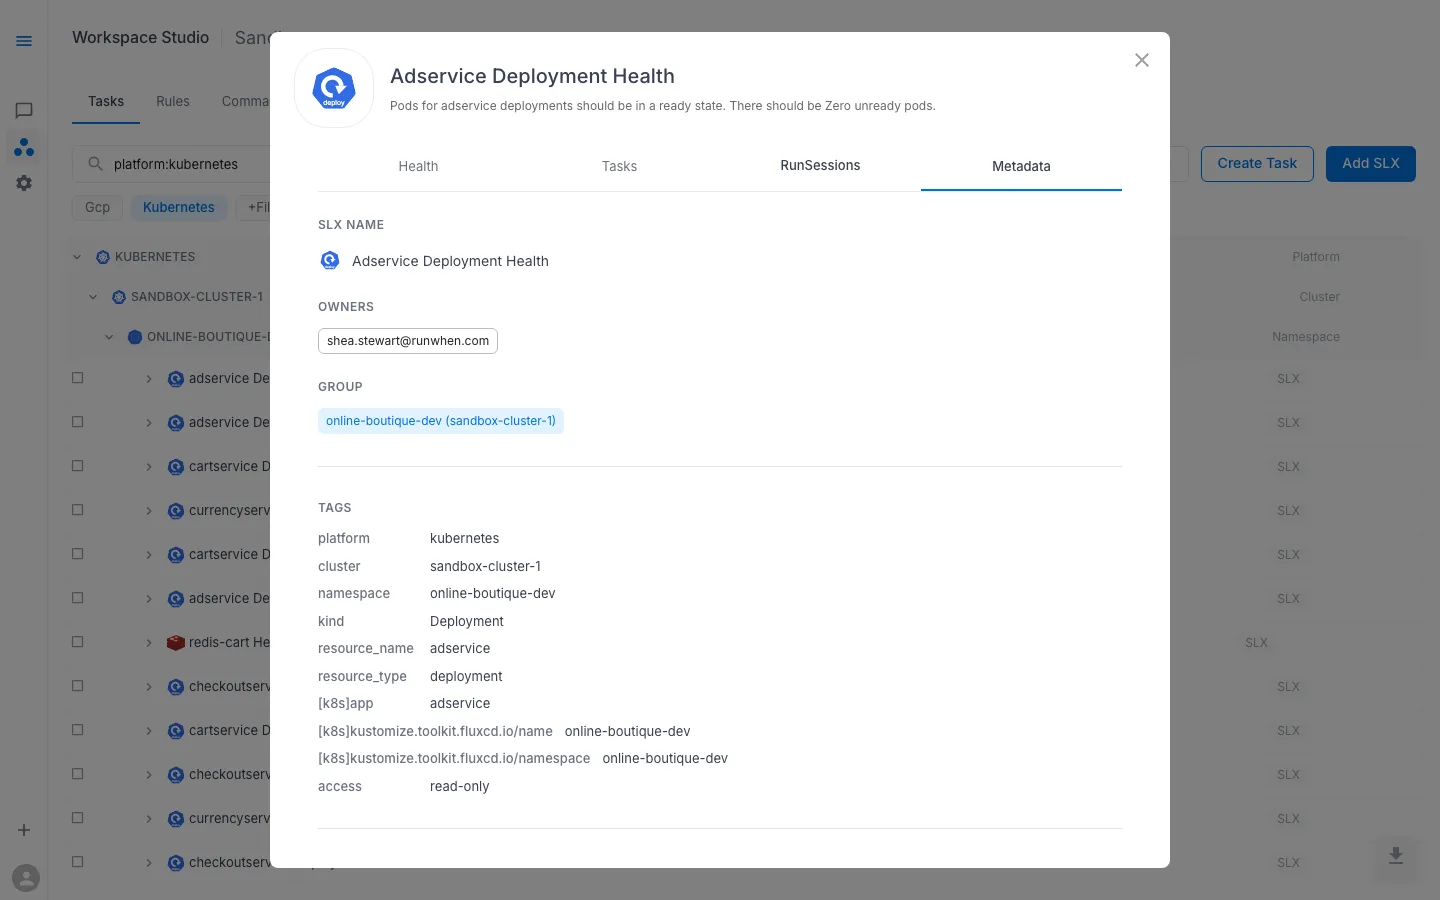
The Metadata tab shows the SLX name, owners, resource group, and all tags (platform, cluster, namespace, resource type, access level) that drive alert routing and task discovery.
When creating or editing an SLI through the UI, the platform presents the key fields described in the spec reference below — interval, CodeBundle, alert thresholds, and task triggers — without requiring you to write YAML directly.
Spec Reference
The sections below document the full SLI Custom Resource spec for users who manage SLX configuration through Git or need to understand the underlying data model.
SLI Spec Overview
apiVersion: runwhen.com/v1kind: ServiceLevelIndicatormetadata: name: my-workspace--my-slx-sli labels: workspace: my-workspace slx: my-workspace--my-slxspec: codeBundle: repoUrl: https://github.com/runwhen-contrib/rw-cli-codecollection pathToRobot: codebundles/k8s-namespace-healthcheck/sli.robot ref: main intervalSeconds: 60 intervalStrategy: intermezzo locations: - northamerica-northeast2-01 configProvided: - name: NAMESPACE value: production secretsProvided: - name: kubeconfig workspaceKey: kubeconfig displayUnitsLong: "percent available" displayUnitsShort: "%" alerts: warning: operator: "lt" threshold: "0.99" for: "5m" ticket: operator: "lt" threshold: "0.95" for: "10m" page: operator: "lt" threshold: "0.9" alertConfig: tasks: persona: eager-edgar sessionTTL: 10mSpec Fields
| Field | Type | Default | Description |
|---|---|---|---|
codeBundle | object | required | Git reference to the SLI script |
intervalSeconds | integer | 60 | How often the SLI runs (in seconds) |
intervalStrategy | string | intermezzo | Scheduling strategy for the runner |
locations | string[] | — | Runner location(s) where the SLI executes |
configProvided | object[] | — | Environment variables passed to the script |
secretsProvided | object[] | — | Workspace secrets mapped into the script |
servicesProvided | object[] | — | Location service bindings |
displayUnitsLong | string | — | Human-readable unit label (e.g. “percent available”) |
displayUnitsShort | string | — | Short unit label, max 3 characters (e.g. ”%”, “ms”) |
alerts | object | — | Threshold alert configuration (see below) |
alertConfig | object | — | RunSession defaults when an SLI alert fires (see below) |
Thresholds (spec.alerts) and RunSession defaults (spec.alertConfig)
| Key | Role |
|---|---|
spec.alerts | Defines when to raise an alert: compares the primary SLI metric to configured thresholds for each severity (warning, ticket, page). |
spec.alertConfig | Defines how automated investigation runs: which AI Assistant to use and the RunSession deduplication window. |
In native ServiceLevelIndicator YAML (for example GitOps manifests), both keys are used as shown in the overview example above.
Serialization note: Workspace API responses and UI exports sometimes nest tasks.persona and tasks.sessionTTL under spec.alerts instead of under spec.alertConfig. A block containing tasks is the RunSession-defaults payload regardless of the parent key. In hand-authored CRD YAML, keep threshold definitions under spec.alerts and RunSession defaults under spec.alertConfig so both can appear in the same document without ambiguity.
CodeBundle
The codeBundle field points to the script that the SLI runs:
| Field | Required | Description |
|---|---|---|
repoUrl | Yes | Git repository URL |
pathToRobot | Yes | Path to the .robot file within the repository |
ref | Yes | Git ref — branch, tag, or commit (default: main) |
Config and Secrets
configProvided — static environment variables:
configProvided: - name: NAMESPACE value: production - name: CONTEXT valueFrom: workspace: CONTEXTEach entry supports either a literal value or a valueFrom reference that resolves from the workspace or SLX configuration.
secretsProvided — workspace secret mappings:
secretsProvided: - name: kubeconfig workspaceKey: kubeconfigThe workspaceKey references a secret stored in the workspace’s secret store.
Threshold Alerts (spec.alerts)
Threshold alerts fire when the SLI metric crosses a user-defined value. Your SLI script can return any numeric value — not just 0 or 1 — giving you full control over how the metric is evaluated.
Structure
Threshold alerts are defined per severity level:
alerts: warning: operator: "lt" threshold: "0.95" for: "5m" ticket: operator: "lt" threshold: "0.9" for: "10m" page: operator: "lt" threshold: "0.8"Fields
| Field | Required | Type | Description |
|---|---|---|---|
operator | Yes | string | Comparison operator for the metric value |
threshold | Yes | string | Numeric value to compare against (parsed as float64) |
for | No | string | Duration the condition must hold before firing (e.g. 5m, 1h) |
Operators
| Word | Symbol | Meaning |
|---|---|---|
lt | < | Less than |
le | <= | Less than or equal to |
eq | == | Equal to |
ge | >= | Greater than or equal to |
gt | > | Greater than |
ne | != | Not equal to |
Severity Levels
| Severity | Typical Use |
|---|---|
warning | Informational — may not require immediate action |
ticket | Should be investigated |
page | Requires immediate response |
You can define one, two, or all three. Each operates independently with its own operator, threshold, and duration.
The for Duration
When for is set, the condition must be continuously true for the specified duration before the alert fires. This prevents transient fluctuations from triggering false alerts.
Without for — fires immediately:
metric_name < 0.95With for: "5m" — fires after 5 minutes:
last_over_time(metric_name[5m]) < 0.95Alert Modes
Each threshold alert has a mode (managed in CRD status, not spec):
| Mode | Behavior |
|---|---|
active | Alert fires when threshold is breached (default) |
silenced | Alert does not fire but is still visible in the UI |
disabled | Alert is completely disabled and hidden |
RunSession defaults (spec.alertConfig)
After an SLI alert fires—whether from threshold rules on the primary metric or from sub-metric rules on per-check series—the platform may create an automated RunSession using the AI Assistant and deduplication window defined here.
The CRD defines only a nested tasks object under alertConfig; no additional alertConfig fields are specified.
alertConfig: tasks: persona: eager-edgar sessionTTL: 10mField reference
| Path | Required | Type | Description |
|---|---|---|---|
tasks | No | object | When omitted or empty, the platform applies its built-in defaults for automated investigation. |
tasks.persona | No | string | AI Assistant short name in the workspace (for example eager-edgar). The assistant must exist and be usable for automated runs. Profile names and setup are documented under AI Assistants. |
tasks.sessionTTL | No | string | RunSession deduplication interval for SLI-driven automation, expressed as a Prometheus-style duration (10m, 1h, 30s). Limits how often a new automated run starts while the alert condition persists. Duration strings match the CRD; some API responses may expose the same value as a number. |
Defaults if omitted
When alertConfig is absent, empty, or has no tasks fields, the platform uses default persona and session TTL values when opening RunSessions from SLI alerts.
Sub-metric alerting
When alertConfig is present and non-empty, the platform may register sub-metric alert rules in addition to any spec.alerts thresholds. Those rules watch auxiliary series whose names extend the primary SLI metric with a __ segment (for example my_ws__my_slx__some_check). Alerting fires when any such series falls below 1; that comparison is not configurable through alertConfig. The alertConfig block still supplies persona and sessionTTL for automation triggered by those alerts. Threshold severities, operators, thresholds, and for durations under spec.alerts remain author-defined.
Combined example
The following pattern pairs threshold rules on the primary metric with RunSession defaults for automated investigation:
spec: alertConfig: tasks: persona: eager-edgar sessionTTL: 10m alerts: warning: operator: lt threshold: "0.95" for: "5m"For metrics on a 0–1 “health” scale, lt with thresholds below 1 is the usual pattern (fire when health drops). Operators and thresholds must align with the SLI script’s output range and semantics; a gt / 0 pair on such a scale would evaluate true for almost any non-zero value and is rarely desirable for warnings.
Threshold Alert Examples
Availability (0.0 – 1.0)
alerts: warning: operator: "lt" threshold: "0.99" for: "5m" ticket: operator: "lt" threshold: "0.95" for: "10m" page: operator: "lt" threshold: "0.9"Response Latency (milliseconds)
alerts: warning: operator: "gt" threshold: "200" for: "5m" page: operator: "gt" threshold: "500"Unhealthy Pod Count
alerts: ticket: operator: "ge" threshold: "1" page: operator: "ge" threshold: "3"Error Rate (percentage)
alerts: warning: operator: "gt" threshold: "1" for: "10m" ticket: operator: "gt" threshold: "5" for: "5m" page: operator: "gt" threshold: "10"How SLI Alerts Are Evaluated
- SLI script runs on the configured
intervalSecondsschedule at the specified runner location - Metric is stored under the SLX’s metric name
- Alert rules are generated from
spec.alertsthresholds and evaluated continuously - When a threshold is breached — immediately, or after the
forduration — the alert fires - An issue is created and linked to the SLX
- Automated investigation — when RunSession defaults are set (
spec.alertConfig, or atasksblock nested underspec.alertsin certain API shapes), the platform opens or deduplicates a RunSession using the configured persona and sessionTTL
Related Pages
- SLXs (Learn) — conceptual overview of SLXs
- SLO Configuration — error budget alerting against SLI metrics
- Task & Runbook Configuration — task execution configuration