SLO Configuration
A Service Level Objective (SLO) defines a reliability target for your service. RunWhen SLOs use multi-window, multi-burn-rate (MWMB) alert rules generated from a simple objective definition. When error budget burn rate exceeds safe thresholds, alerts fire automatically.
Managing SLOs in the UI
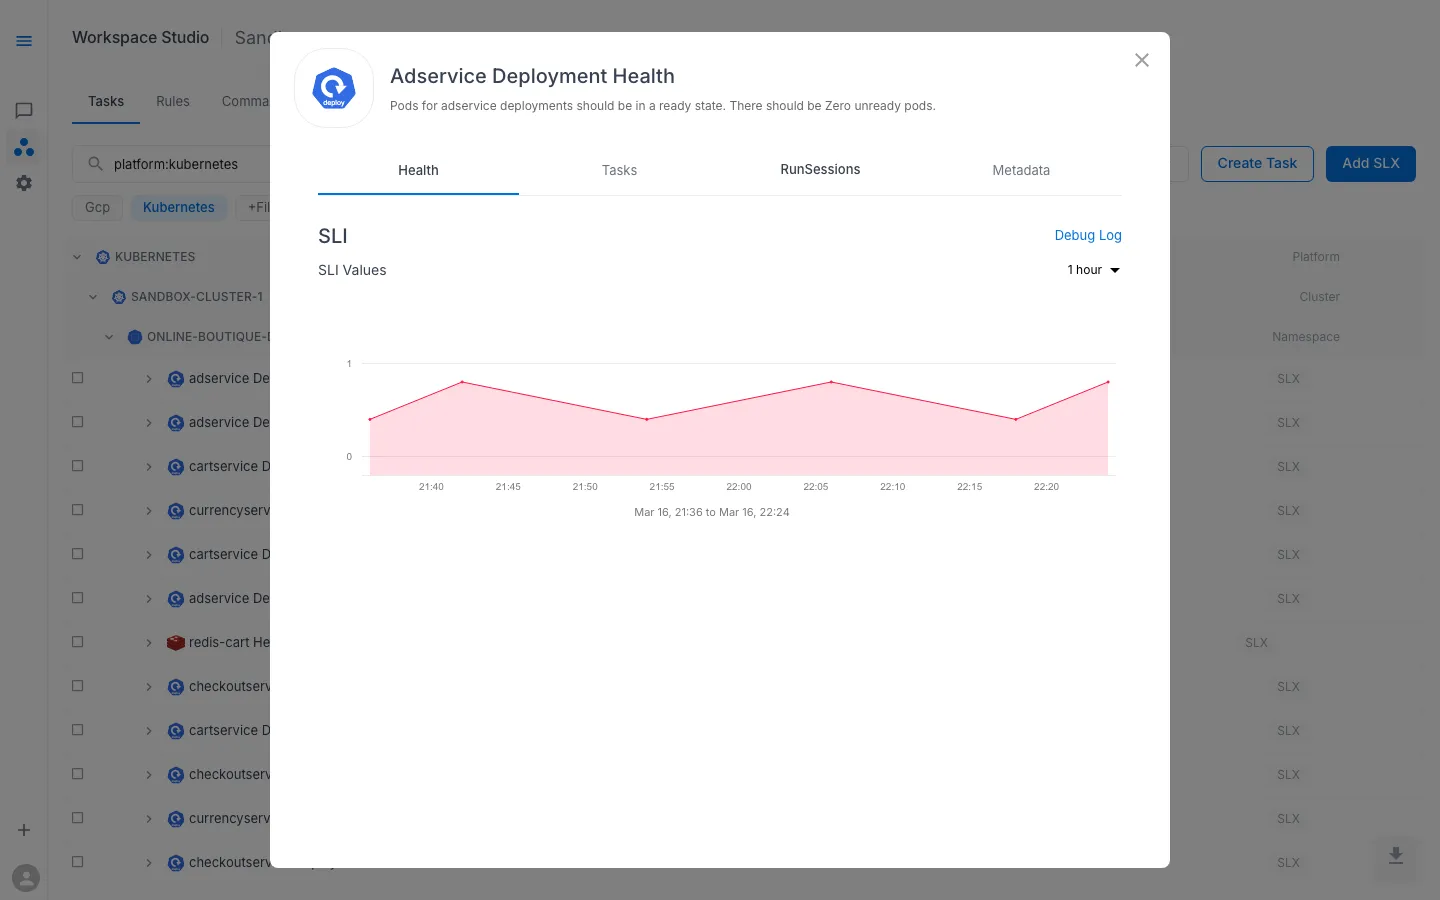
SLOs appear alongside their parent SLX in Workspace Studio > Tasks. Open the SLX Preview (eye icon) to access health and run data.
The Health tab shows the SLI metric that the SLO tracks. When an SLO is configured, the platform uses this metric together with the objective percentage to calculate error budget consumption and burn rate.
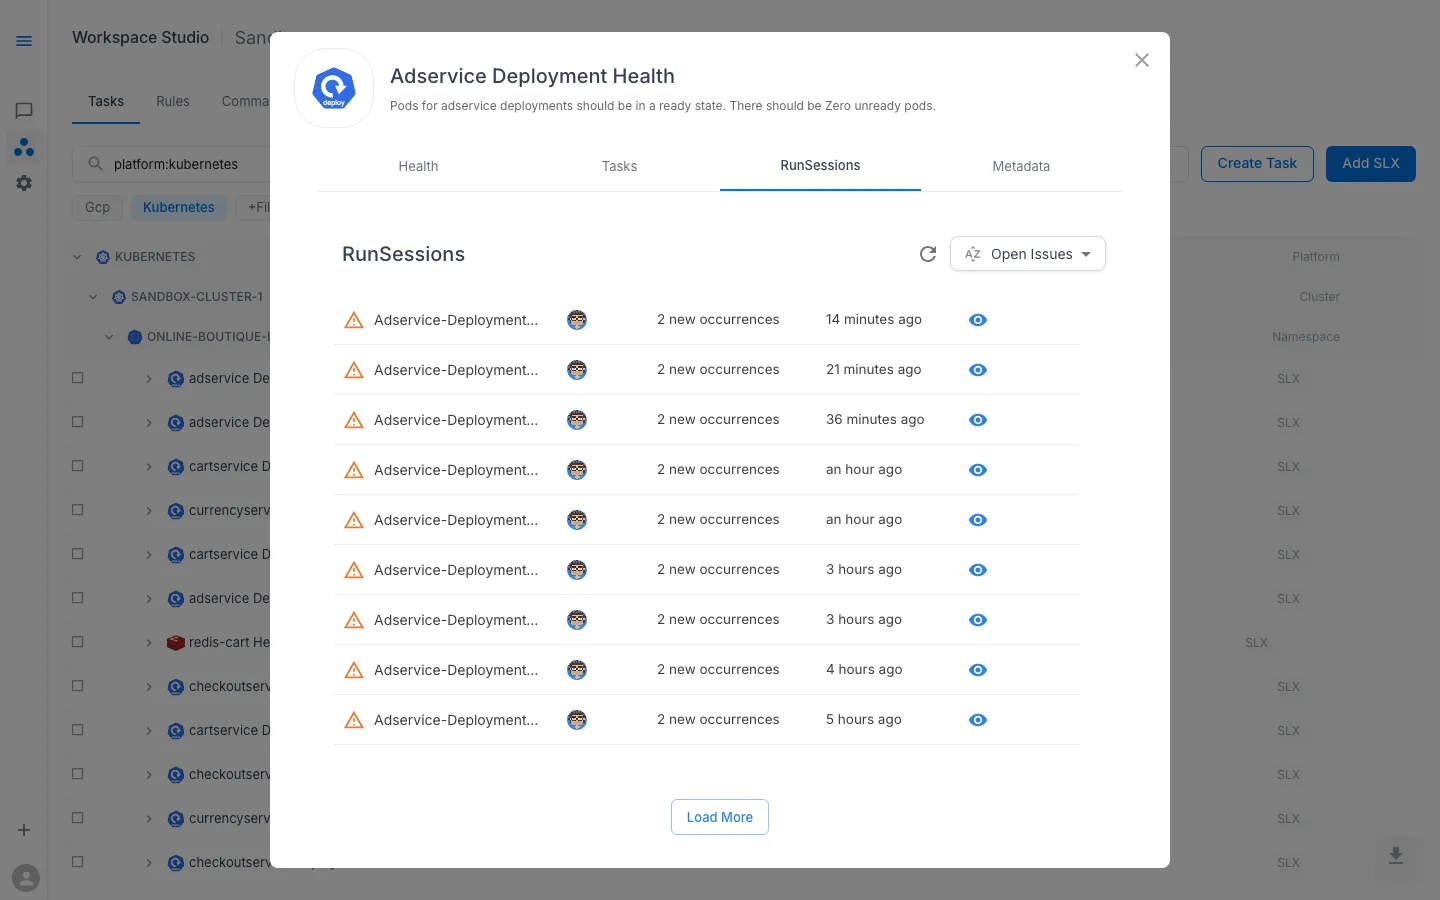
The RunSessions tab lists historical task runs triggered by SLO burn-rate alerts, alongside manually triggered runs. Each session shows the number of issues found and when it last ran.
When creating or editing an SLO through the UI, you set the objective percentage and threshold — the platform handles the alert rule generation automatically.
Spec Reference
The sections below document the full SLO Custom Resource spec for users who manage SLX configuration through Git or need to understand the underlying data model.
SLO Spec Overview
apiVersion: runwhen.com/v1kind: ServiceLevelObjectivemetadata: name: my-workspace--my-slx-slo labels: workspace: my-workspace slx: my-workspace--my-slxspec: codeBundle: repoUrl: https://github.com/runwhen-contrib/rw-cli-codecollection pathToYaml: codebundles/slo-default/queries.yaml ref: main slxSpecType: simple-mwmb objective: 99.9 threshold: 9 operand: eqSpec Fields
| Field | Type | Default | Description |
|---|---|---|---|
codeBundle | object | required | Git reference to the queries.yaml file |
slxSpecType | string | simple-mwmb | SLO type — currently only simple-mwmb is supported |
objective | float | 99.9 | Target reliability percentage (e.g. 99, 99.9, 99.99) |
threshold | float | 9 | Value at which the metric is considered “out of SLO” |
operand | string | eq | Comparison operator applied to the threshold |
CodeBundle (Query Bundle)
Unlike SLIs and Runbooks which reference Robot Framework scripts, the SLO CodeBundle points to a queries.yaml file that defines the query templates:
| Field | Required | Description |
|---|---|---|
repoUrl | Yes | Git repository URL |
pathToYaml | Yes | Path to the queries.yaml file (e.g. codebundles/slo-default/queries.yaml) |
ref | Yes | Git ref (default: main) |
queries.yaml Structure
The query file defines two query templates used to calculate error budget:
errorQuery: "sum_over_time((count({metric_name} > {threshold}))[{window}:]) OR on() vector(0)"totalQuery: "sum_over_time((count({metric_name} > 0))[{window}:])"These placeholders are resolved automatically when the SLO is processed:
| Placeholder | Resolved From |
|---|---|
{metric_name} | SLX name (hyphens replaced with underscores) |
{threshold} | spec.threshold value |
{window} | Time window for burn-rate calculation |
{operand} | Symbol form of spec.operand |
Objective
The objective field sets the target reliability percentage. This determines how much error budget is available before alerts fire.
| Objective | Allowed Downtime (30 days) | Error Budget |
|---|---|---|
| 99.0 | ~7.2 hours | 1.0% |
| 99.9 | ~43 minutes | 0.1% |
| 99.99 | ~4.3 minutes | 0.01% |
Operand
The operand field defines how the SLI metric is compared against the threshold to determine if the service is “in SLO” or “out of SLO”:
| Operand | Symbol | Meaning |
|---|---|---|
eq | == | Out of SLO when metric equals threshold |
lt | < | Out of SLO when metric is less than threshold |
gt | > | Out of SLO when metric is greater than threshold |
neq | != | Out of SLO when metric does not equal threshold |
le | <= | Out of SLO when metric is less than or equal to threshold |
ge | >= | Out of SLO when metric is greater than or equal to threshold |
How SLO Alerts Work
SLO alerts use a Multi-Window Multi-Burn-Rate (MWMB) methodology, which is different from simple threshold alerting:
- Error budget calculation — the platform calculates error and total events using the queries from
queries.yaml - Burn rate windows — multiple time windows are evaluated simultaneously (e.g. 1h, 6h, 3d) to detect both fast and slow budget consumption
- Alert generation — the platform generates alert rules with two tiers:
| Alert Type | Severity | Trigger |
|---|---|---|
| Page | High — immediate response | Error budget is being consumed rapidly (short window burn rate exceeded) |
| Ticket | Medium — investigate soon | Error budget is being consumed steadily (long window burn rate exceeded) |
- Evaluation — the generated rules are evaluated continuously against your SLI metric
SLO vs SLI Alerts
| Aspect | SLI Threshold Alerts | SLO Burn-Rate Alerts |
|---|---|---|
| What triggers it | Metric crosses a single threshold | Error budget burn rate exceeds safe levels |
| Time windows | Single optional for duration | Multiple windows evaluated simultaneously |
| Configuration | Operator, threshold, duration per severity | Objective percentage + threshold |
| Best for | Immediate metric anomalies | Sustained reliability degradation |
Example Configurations
Standard availability SLO (99.9%)
spec: objective: 99.9 threshold: 9 operand: eq codeBundle: repoUrl: https://github.com/runwhen-contrib/rw-cli-codecollection pathToYaml: codebundles/slo-default/queries.yaml ref: mainRelaxed SLO for non-critical service (99%)
spec: objective: 99 threshold: 5 operand: gt codeBundle: repoUrl: https://github.com/runwhen-contrib/rw-cli-codecollection pathToYaml: codebundles/slo-default/queries.yaml ref: mainStrict SLO for payment service (99.99%)
spec: objective: 99.99 threshold: 1 operand: lt codeBundle: repoUrl: https://github.com/runwhen-contrib/rw-cli-codecollection pathToYaml: codebundles/slo-default/queries.yaml ref: mainRelated Pages
- SLXs (Learn) — conceptual overview of SLXs
- SLI Configuration — SLI metric collection and threshold alerts
- Task & Runbook Configuration — task execution configuration