Service Level Expectations (SLXs)
An SLX (Service Level Expectation) is the core unit of operational knowledge in RunWhen. Each SLX represents a specific service, component, or concern that you want to monitor, analyze, or troubleshoot.
Think of an SLX as the “operational wrapper” around a piece of your infrastructure. It defines:
- What the service is — metadata, ownership, tags, and relationships to other SLXs
- How to measure it — health indicators and signals that describe its current state
- What to do when something is wrong — associated tasks that diagnose or resolve issues
How SLXs Fit Together
SLXs are the building blocks that the platform uses to understand your environment. They enable:
- Targeted diagnostics — when you ask “Why is checkout failing?”, the assistant knows which SLXs are relevant and which tasks to run
- Background monitoring — tasks attached to SLXs run continuously in the background, building production insights
- Issue detection — when a task detects a problem, it raises an Issue linked to the SLX
- Dependency mapping — SLXs can reference other SLXs, letting the platform trace impact across services
Automatic SLX Generation
In most deployments, SLXs are generated automatically by the workspace builder component of RunWhen Local. The workspace builder discovers resources in your clusters (deployments, services, ingresses, etc.) and creates SLXs with appropriate tasks attached. You don’t need to define SLXs manually unless you want custom monitoring logic.
Browsing SLXs
SLXs and their associated tasks appear in Workspace Studio > Tasks. Tasks are grouped by platform (e.g., Kubernetes, GCP) and can be searched and filtered.
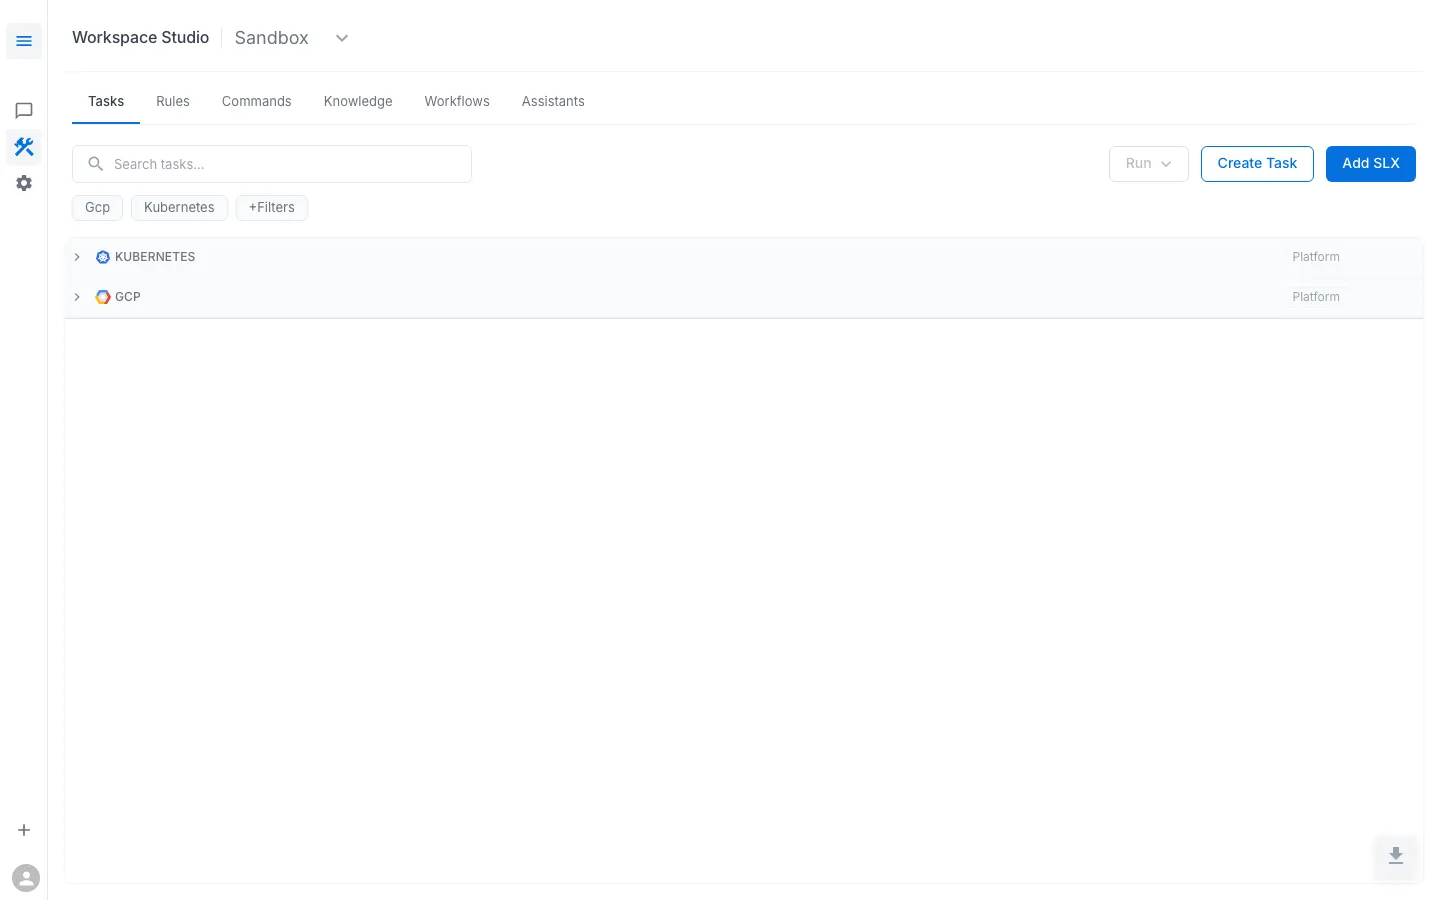
From this view you can:
- Browse existing tasks grouped by platform category
- Search for specific tasks by name or keyword
- Run a task manually using the Run dropdown
- Create a new custom task with Create Task
- Add a new SLX with Add SLX
Creating an SLX Manually
To create an SLX:
-
Go to Workspace Studio > Tasks
-
Click Add SLX
-
Write a statement that captures the component and the reliability target. For example:
- “The API should return 99% of GET requests within 200ms”
- “The daily batch processing pipeline should complete in less than a day”
-
Optionally attach health indicators (SLIs), objectives (SLOs), or tasks
-
Click Commit to save
SLX Components
| Component | Purpose |
|---|---|
| Statement | A plain-language description of what the SLX monitors and the expected reliability |
| SLIs (Indicators) | Automated measurements that run on a schedule — e.g., scraping metrics, running synthetic checks |
| SLOs (Objectives) | Thresholds defined as Prometheus query fragments that track error budgets and fire alerts |
| Tasks | Diagnostic or remediation scripts that run on demand or in response to alerts |