Scenario 3: Database Connection Failure (Prod)
Overview
The Online Boutique production environment is partially degraded. The frontend loads and users can browse products, but placing an order intermittently fails. The checkout service is logging a fatal database connection pool error and panicking — but the checkout code itself is correct and no recent code changes were deployed.
What you’ll learn:
- Investigate partial application failures where some features work and others don’t
- Trace errors from a service to a database connection pool exhaustion
- Differentiate between application bugs and infrastructure-layer resource exhaustion
- Work through a multi-layer investigation from user symptom to root cause
Difficulty: Intermediate Time required: 15-20 minutes
The Problem
What’s happening: User browses products (Frontend) -> User places an order -> Checkout Service processes the order -> Checkout Service hits database connection pool limit -> Checkout Service panics with FATAL error -> Pod crashes and enters CrashLoopBackOff.
What you know:
- The
online-boutique-prodenvironment was stable until recently - Users can browse products and add items to cart
- Placing an order fails intermittently — some orders succeed, others crash the service
- No code changes were deployed recently
What you need to find out:
- Which service is actually failing?
- Is it a code bug or something else?
- What is causing the failure if the code hasn’t changed?
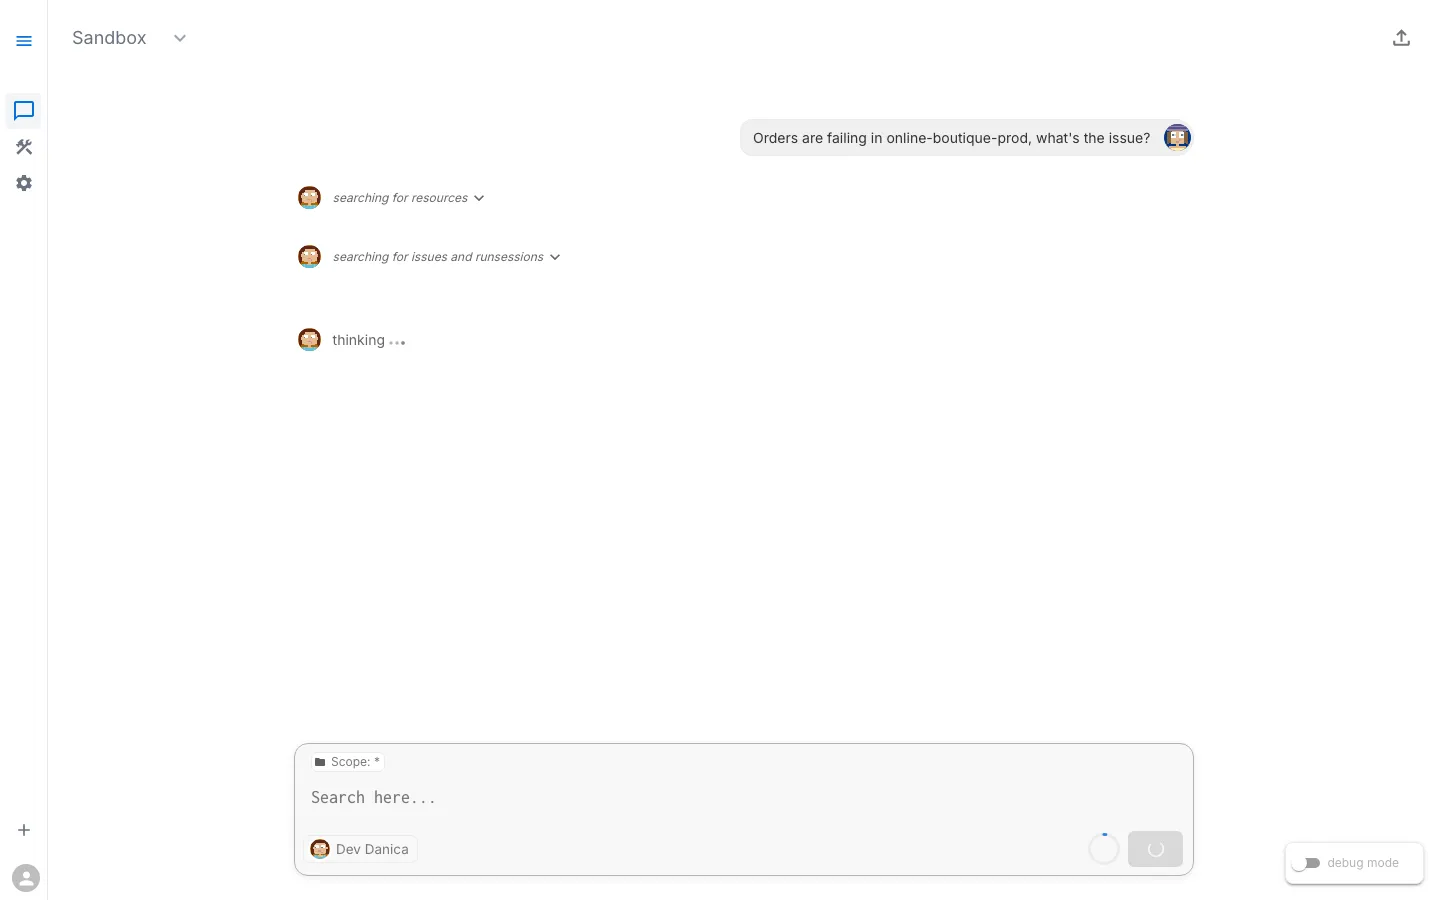
Step 1: Open Workspace Chat
- Open the Sandbox workspace
- Go to Workspace Chat
- Ask the AI Assistant about the prod environment — for example: “Check the health of online-boutique-prod” or “Are there any issues in the production namespace?”
This scenario is more complex because the failure is intermittent. The checkout service processes most orders successfully but panics on roughly 5% of requests, eventually entering CrashLoopBackOff.
Step 2: Describe the Symptom
Start by describing what users are experiencing. Don’t try to guess the root cause — let the AI Assistant investigate.
Sample Prompts
- “Users can’t complete checkout in online-boutique-prod”
- “Orders are failing in the production namespace”
- “online-boutique-prod is partially down — browsing works but checkout doesn’t”
- “The checkout service keeps crashing in production”
What Happens Next
The AI Assistant may respond in one of two ways:
- Show existing Issues — If the platform has already detected the crashing checkout service (e.g., through background health checks), the assistant will surface these existing Issues with their findings, severity, and suggested next steps.
- Suggest diagnostic tasks to run — If no existing Issues cover the problem, the assistant will suggest tasks to check pods, logs, events, and service health. You can run individual tasks or let the assistant run them together.
Either path leads to the same result: structured findings about what is wrong.
Typical Diagnostic Tasks
The assistant may suggest or reference results from tasks such as:
- Check Pod Status — Review all pods in the namespace
- Inspect Checkout Service Logs — Look for error details
- Check Deployment Health — Verify replica availability
- Check Recent Events — Look for cluster-level warnings
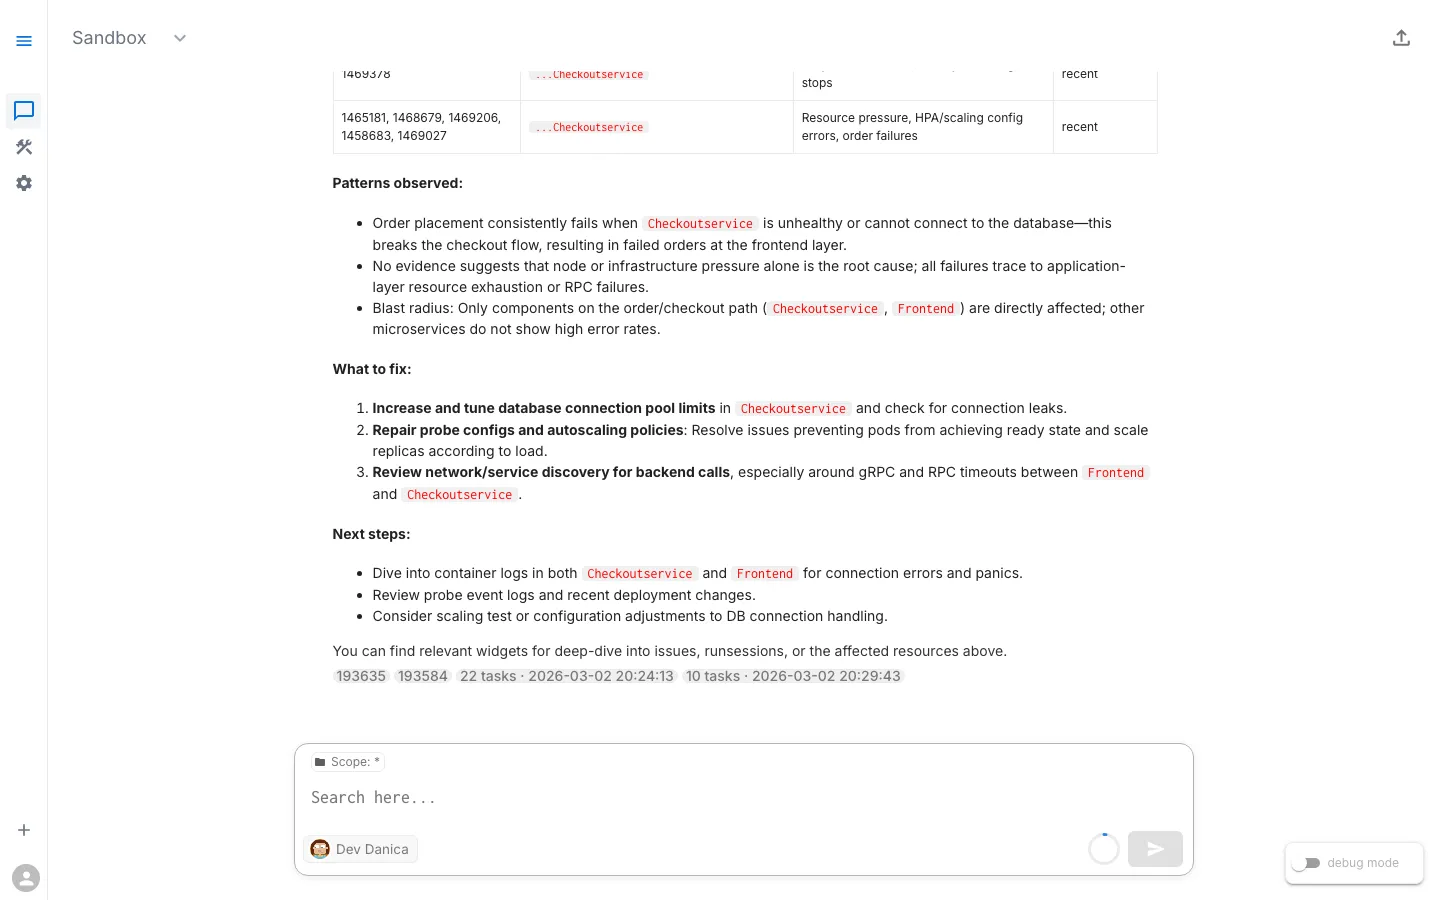
Step 3: Review the Findings
The assistant investigates and presents structured results. This investigation reveals a clear trail.
Expected Findings
Finding 1: Checkout Service in CrashLoopBackOff
checkoutservice pod is in CrashLoopBackOffRestart count: 90+Container: serverAt first glance this looks like Scenario 1 (a code crash). But the error message tells a very different story.
Finding 2: Logs Show Database Connection Pool Exhaustion
checkoutservice logs: [PlaceOrder] SIMULATED FAILURE: Database connection pool exhausted panic: FATAL: Database connection pool exhausted - unable to process order for user abc-123. Connection timeout after 30s. Active connections: 100/100. Please check database connection settings and increase pool size.This is the key finding. The checkout service is not crashing because of a code bug — it is panicking because every database connection in the pool is in use and new requests cannot be served.
Finding 3: The Crash is Intermittent
Some PlaceOrder requests succeed:  "payment went through (transaction_id: ...)"  "order confirmation email sent to ..."
Others trigger the connection pool panic.Approximately 5% failure rate under load.
The service works most of the time but fails under certain load conditions when the connection pool is saturated.
Finding 4: Warning Events
Events in online-boutique-prod: Back-off restarting failed container 'server' in pod checkoutservice-xxx Repeated over the past several hoursStep 4: Trace the Dependency Chain
Investigation layers (top to bottom):
- Layer 1 — User-Facing Symptom: Placing an order fails intermittently
- Layer 2 — Service Layer: Checkout service panics with
FATAL: Database connection pool exhausted - Layer 3 — Data Layer: Connection pool at 100/100 active connections, new requests time out after 30s
- Layer 4 — Infrastructure: Pool size is too small for current traffic, or connections are leaking
Each layer points to the one below it. The user sees “order failed,” but the root cause is a database connection pool that cannot keep up with demand.
Following the Trail
This is the key lesson of this scenario — the user-facing symptom (checkout fails) looks like a code crash (CrashLoopBackOff) but is actually an infrastructure resource exhaustion issue.
| Layer | What You See | What It Means |
|---|---|---|
| User Experience | ”Place Order” fails intermittently | Something downstream is failing under load |
| Checkout Service | FATAL: Database connection pool exhausted... Active connections: 100/100 | The service code is correct — it cannot get a database connection |
| Connection Pool | 100/100 connections active, new requests wait and time out | The pool is saturated |
| Infrastructure | Pool limit too low for current traffic, or connections are not being released | Configuration or resources do not match the current load |
Root Cause
The checkout service is hitting its database connection pool limit under load. All 100 connections are in use, and new requests wait until they time out after 30 seconds, at which point the service panics. This is not a code bug — the checkout logic is correct. The issue is that the connection pool configuration cannot handle the current traffic volume.
This could be caused by:
- Connection pool limit too low: Traffic has grown beyond what the configured pool size can handle
- Connection leak: The application opens connections but does not close them properly, gradually exhausting the pool
- Slow queries: Long-running queries hold connections open, preventing others from being served
Step 5: Ask for Remediation Guidance
Sample Follow-Up Prompts
- “How do I fix the database connection pool issue in online-boutique-prod?”
- “The checkout service has exhausted its database connections — what should I do?”
- “Increase the database connection pool limit for checkoutservice”
The Fix
Depending on the root cause, the assistant may suggest one or more approaches:
Fix A: Increase the Connection Pool Size
If traffic has grown and the pool limit is too low, increase it via the checkout service deployment:
env: - name: DB_MAX_CONNECTIONS value: "200" - name: DB_POOL_TIMEOUT value: "60s"Fix B: Scale the Checkout Service Horizontally
Add more replicas to distribute load across multiple connection pools:
kubectl scale deployment/checkoutservice --replicas=3 -n online-boutique-prodFix C: Add a Connection Pooler
For a more robust solution, deploy a connection pooler (e.g., PgBouncer) in front of the database to manage connections efficiently and prevent any single service instance from exhausting the pool.
After applying the fix, restart the checkout service:
kubectl rollout restart deployment/checkoutservice -n online-boutique-prodStep 6: Verify the Fix
Verification Steps
This scenario requires verifying at every layer of the dependency chain — not just the component you fixed.
Verification chain: Is the connection pool healthy? -> Is checkout processing orders? -> End-to-End OK
Ask the AI Assistant to Verify
- “Is the checkout service healthy in online-boutique-prod?”
- “Can checkoutservice process orders now?”
- “Are there still connection timeout errors?”
Success Criteria
- Checkout service no longer in CrashLoopBackOff
- No connection pool exhaustion errors in logs
- Checkout service processing orders successfully
- Order flow completes from frontend
- No warning or error events in the namespace
What You Learned
Key Takeaways
- CrashLoopBackOff does not always mean a code bug. In Scenario 1, CrashLoopBackOff was caused by a nil pointer dereference (code bug). Here, the same symptom is caused by resource exhaustion (infrastructure issue). The logs tell you which one it is.
- Follow the dependency chain. The user sees “checkout failed.” The logs say “connection pool exhausted.” The fix is not in the checkout code — it is in the pool configuration or database capacity.
- Intermittent failures point to resource limits. When a service works most of the time but fails under load, look for resource ceilings: connection pools, memory limits, CPU throttling, rate limits.
- Read the error message carefully. The panic message says exactly what is wrong: “Active connections: 100/100. Please check database connection settings and increase pool size.” Production-quality error messages are diagnostic gold.
- Infrastructure issues are the hardest to diagnose. The symptom (CrashLoopBackOff) looks identical to Scenario 1, but the root cause is completely different. Only by reading the logs do you distinguish a code bug from a resource exhaustion issue.
Troubleshooting Pattern: Infrastructure / Resource Exhaustion
The pattern: Service crashing under load -> Check logs for resource errors (pool exhaustion, OOM, rate limit) -> Is it a resource ceiling? -> If yes: Increase pool size / scale resources / add pooler. If no: Check for connection leaks / slow queries.
Comparing All Three Scenarios
| Scenario 1: Code | Scenario 2: Config | Scenario 3: Infrastructure | |
|---|---|---|---|
| Symptom | Pod crashing | Feature errors, pods running | Intermittent checkout failures |
| Pod status | CrashLoopBackOff | Running | CrashLoopBackOff (under load) |
| Error location | Startup logs | Runtime logs (DNS failure) | Runtime logs (connection pool) |
| Root cause | Nil pointer bug | Wrong service address | Database connection pool exhaustion |
| Fix location | App source code | Deployment env var | Pool config / database resources |
| Investigation depth | Single pod | Service + config | Multi-layer trace |
| Detection difficulty | Easy | Moderate | Hard |
Tutorial Complete
You have completed all three Online Boutique troubleshooting scenarios. You now know how to:
- Use Workspace Chat to investigate issues in natural language
- Run diagnostic tasks and interpret structured results
- Review Issues surfaced automatically by the platform
- Identify root causes across code, configuration, and infrastructure failures
- Implement fixes and verify at every layer
- Recognize common failure patterns in Kubernetes applications
What is Next?
Apply these skills to your own environment:
- Set up RunWhen for your cluster (see the Quick Start Guide)
- Explore the Skills Registry and browse Skill Templates for production-ready diagnostics
- Learn about AI Assistants and how to customize them
Deepen your knowledge:
- Review How RunWhen Works — Understand production insights and background tasks
- Join the community Slack to discuss what you have learned
View Live Chat Export: Scenario 3 — Database Connection Failure (Prod) — View the full AI conversation, diagnostics, and findings