Scenario 1: Crashing Code Deploy (Dev)
Overview
A developer pushed a code change to the dev branch of the Online Boutique application. Since the merge, the ad service is repeatedly crashing, and the application shows errors when loading product pages.
What you’ll learn:
- Identify pods stuck in
CrashLoopBackOff - Use Workspace Chat and AI Assistants to investigate application crashes
- Read pod logs to find error messages
- Trace the problem back to a code-level issue
- Understand what a fix looks like
Difficulty: Beginner Time required: 15-20 minutes
The Problem
What’s happening: A developer pushes code to the dev branch → Flux syncs it to Kubernetes → The pod deploys → The pod crashes (CrashLoopBackOff) → The frontend shows missing ads and degraded pages.
What you know:
- The
online-boutique-devenvironment was working yesterday - A code change was merged to the
devbranch - Product pages are showing errors or missing advertisement banners
What you need to find out:
- Which service is crashing?
- Why is it crashing?
- What does the error tell us about the fix?
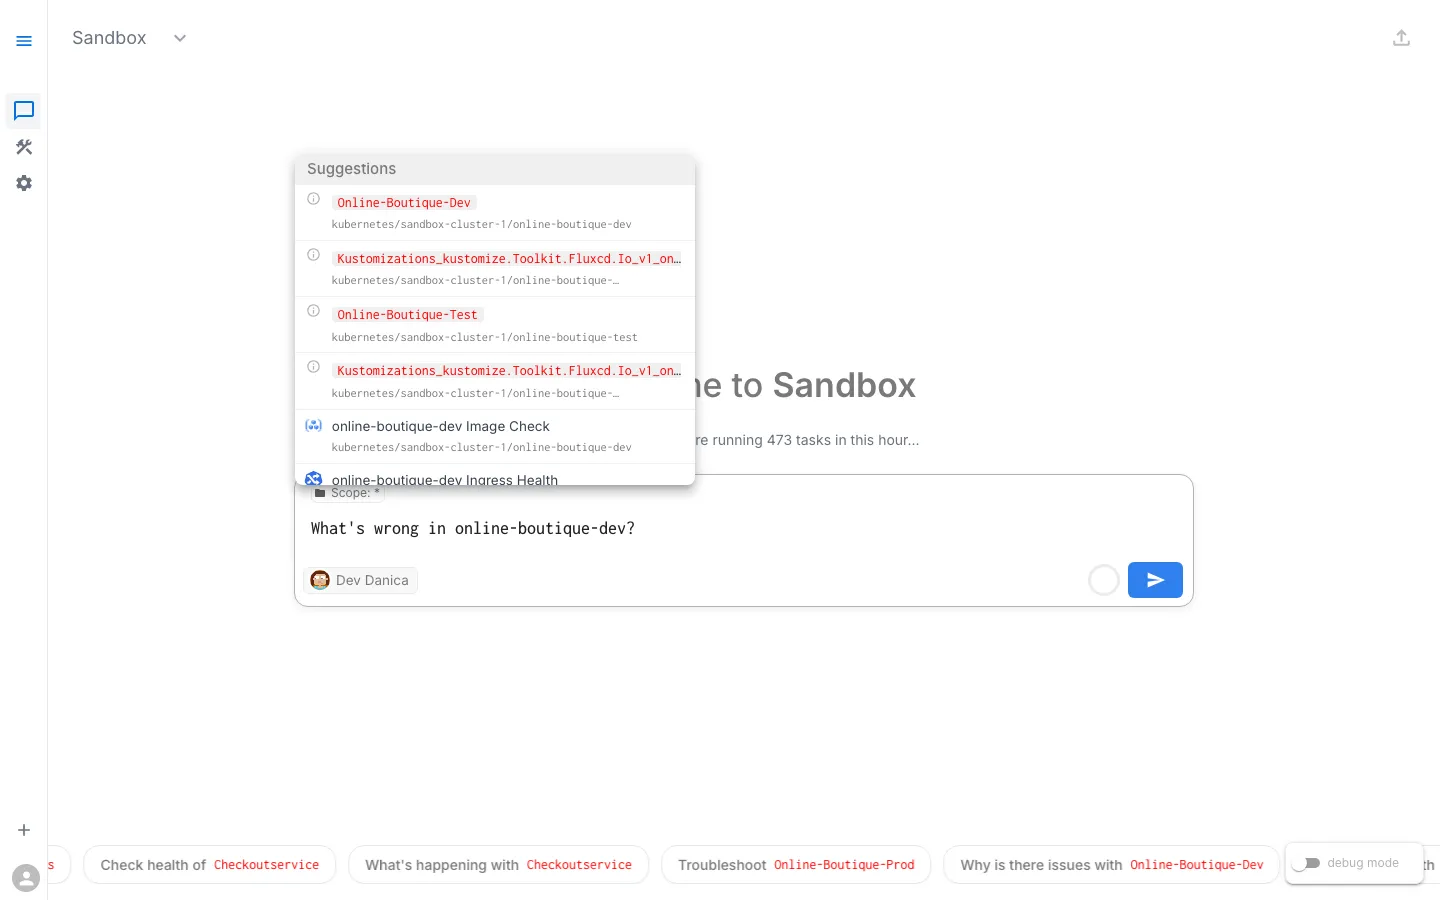
Step 1: Open Workspace Chat
- Open the Sandbox workspace
- Go to Workspace Chat
- Describe the problem to the AI Assistant — for example: “What’s wrong in online-boutique-dev?”
Even a broad prompt is enough to get started. The AI Assistant will identify unhealthy pods, warning events, and deployment issues automatically.
Step 2: Describe the Problem
In Workspace Chat, describe what you see. You don’t need to know exact Kubernetes terminology — just describe the situation.
Sample Prompts
Try any of these:
- “What’s wrong in online-boutique-dev?”
- “There are unhealthy pods in the dev namespace”
- “Check deployment health in online-boutique-dev”
- “The online boutique dev environment has errors”
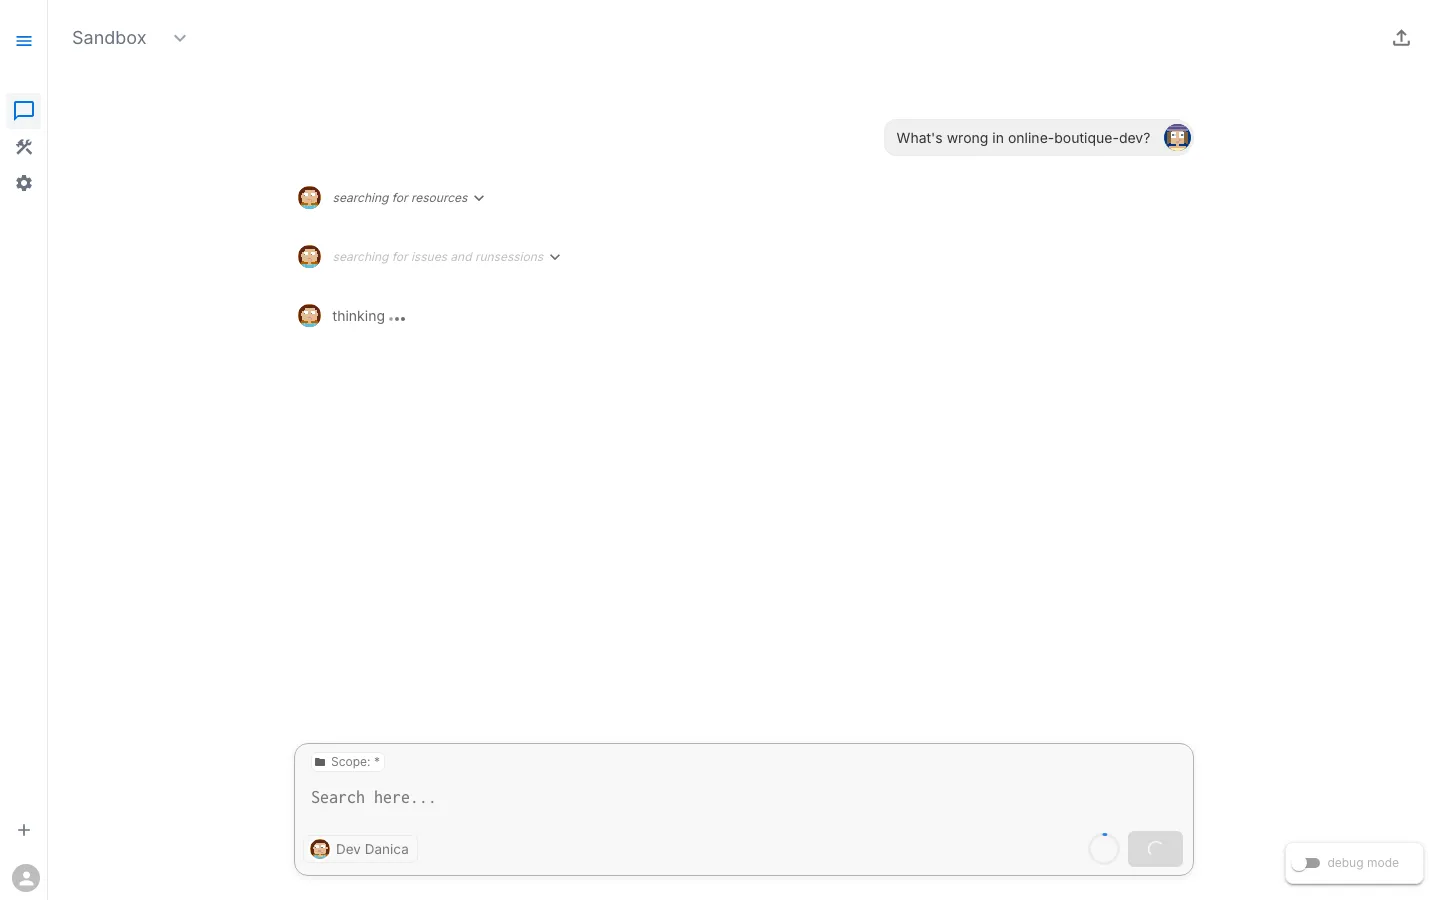
What Happens Next
The AI Assistant may respond in one of two ways:
- Show existing Issues — If the platform has already detected problems (e.g., through background health checks), the assistant will surface these existing Issues with their findings, severity, and suggested next steps.
- Suggest diagnostic tasks to run — If no existing Issues cover the problem, the assistant will suggest tasks like checking pod status, inspecting logs, and reviewing events. You can run individual tasks or let the assistant run them together.
Either path leads to the same result: structured findings about what’s wrong.
Typical Diagnostic Tasks
The assistant may suggest or reference results from tasks such as:
- Check Pod Status — Lists all pods and their current state
- Check Deployment Health — Verifies replica availability
- Inspect Pod Logs — Retrieves logs from crashing containers
- Check Recent Events — Shows Kubernetes events with warnings
Step 3: Review the Findings
After the assistant investigates (either by surfacing existing Issues or running tasks), you’ll see structured findings.
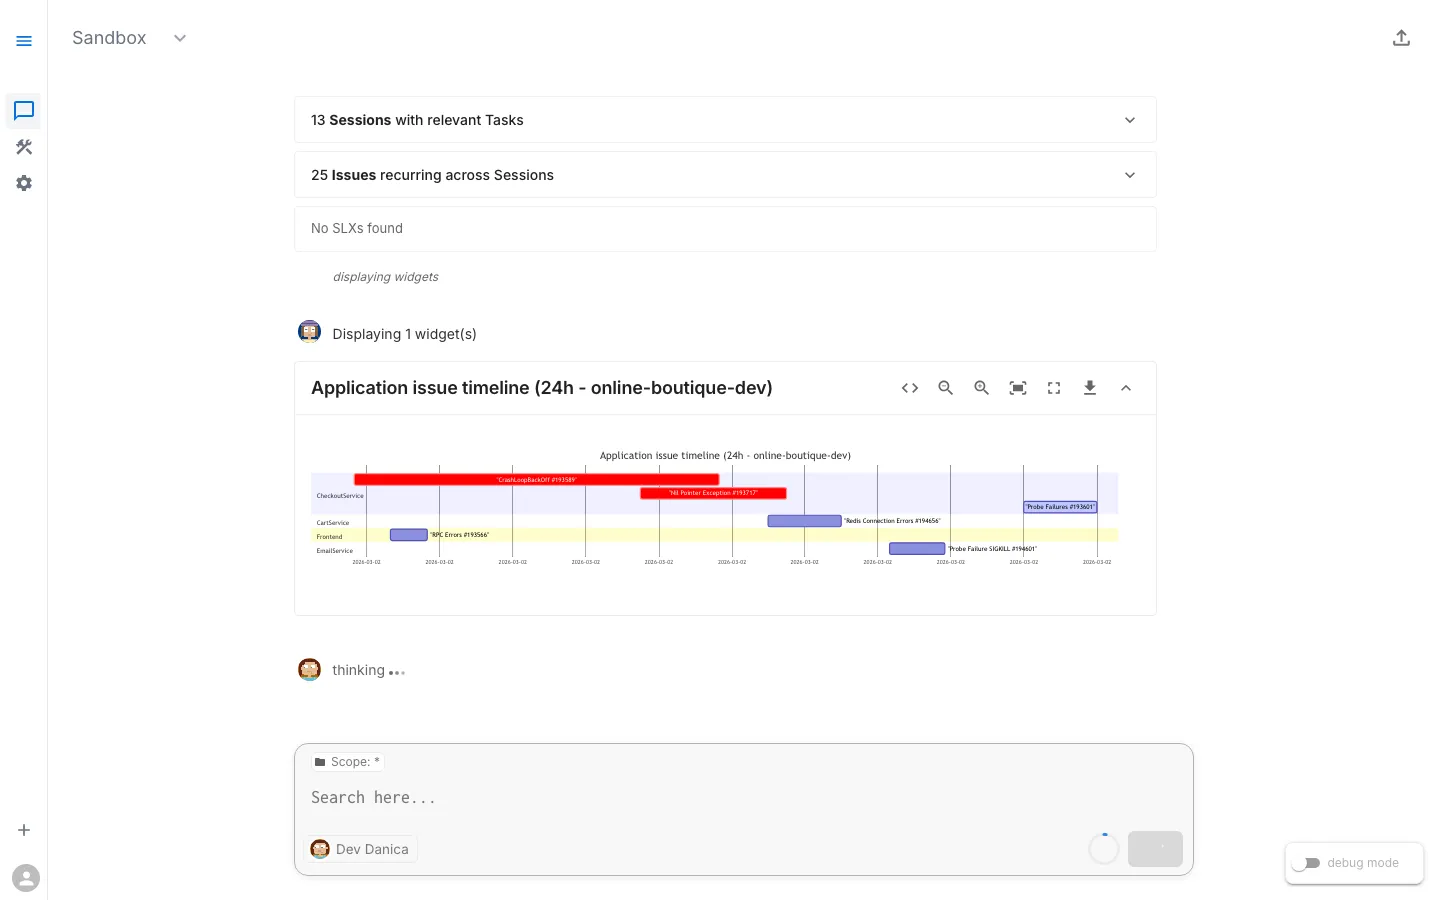
Expected Findings
Finding 1: Pod in CrashLoopBackOff
adservice pod is in CrashLoopBackOffRestart count: 50+Last state: Terminated with exit code 1Container: serverFinding 2: Warning Events
Back-off restarting failed container 'server'in pod adservice-xxxSeen repeatedly over the past several hoursFinding 3: Application Logs Show Fatal Error
FATAL - SIMULATED FAILURE: Unexpected null reference in ad catalog lookupFATAL - Fatal error in getAds — terminating processjava.lang.NullPointerException: Ad catalog reference is null during ad retrieval at hipstershop.AdService$AdServiceImpl.getAds(AdService.java:...)Note: The specific restart count and timing depend on when you check. The key insight is that the application code itself is hitting a fatal error and terminating — not a Kubernetes infrastructure problem.
Step 4: Analyze the Root Cause
Analysis path: Multiple symptoms (Pod CrashLoopBackOff + Warning Events + Exception in Logs) all point to the same root cause → Code error in recent commit.
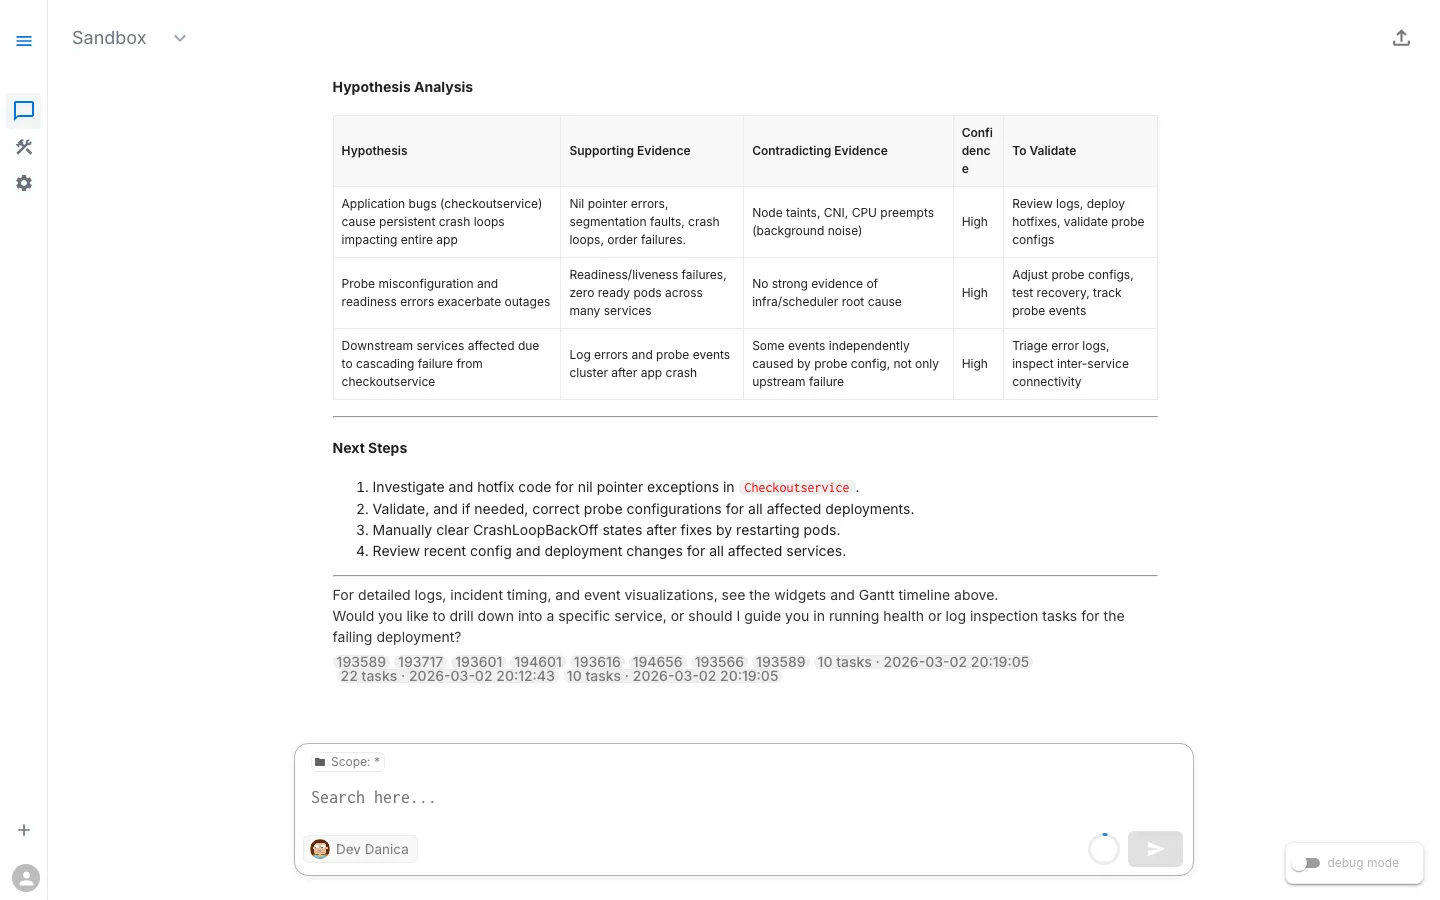
What the Evidence Tells Us
| Signal | What It Means |
|---|---|
CrashLoopBackOff | The container starts, crashes, Kubernetes restarts it, it crashes again — in a loop |
Exit code 1 | The Java application hit a fatal NullPointerException and terminated |
| Fatal error in logs | The application logged a fatal error in the getAds method of AdService.java — a code-level bug |
| Only one service affected | The issue is isolated to the ad service’s code, not a cluster-wide problem |
Root Cause
The adservice has a bug introduced in the most recent code change on the dev branch. The application hits a NullPointerException when serving ad requests — specifically in the getAds() method of AdService.java. The error is fatal and the JVM terminates.
This is a code/application error, the most straightforward category of Kubernetes failures. The Kubernetes infrastructure is working correctly — it’s faithfully trying to run broken code.
Step 5: Ask for Remediation Guidance
Now that you understand the root cause, ask the AI Assistant for help fixing it.
Sample Follow-Up Prompts
- “How do I fix the crashing adservice?”
- “What should I do about this NullPointerException?”
- “Can I roll back to a working version?”
- “Show me what changed in the recent deployment”
Possible Remediation Paths
The assistant may suggest several options:
Option 1: Roll Back the Deployment (quickest resolution)
kubectl rollout undo deployment/adservice -n online-boutique-devThis reverts to the last known-good version while the code bug is fixed.
Option 2: Fix the Code
If you have access to the demo-sandbox-online-boutique-src repository, fix the NullPointerException on the dev branch. Flux will automatically redeploy.
Option 3: Scale Down the Broken Service
If the broken service is not blocking other work:
kubectl scale deployment/adservice --replicas=0 -n online-boutique-devStep 6: Verify the Fix
After applying a fix, confirm the environment is healthy.
Ask the AI Assistant to Verify
- “Is the adservice running now?”
- “Check pod health in online-boutique-dev”
- “Are there still any crashing pods?”
Success Criteria
- All pods in Running state
- No CrashLoopBackOff pods
- Deployment shows desired replica count available
- No new warning events
- Ad banners display correctly on product pages
What You Learned
Key Takeaways
- CrashLoopBackOff is the most common symptom of code errors. When a pod keeps crashing and restarting, start with the logs.
- Logs tell the story. Application-level crashes almost always leave a clear error message in the container logs. RunWhen surfaces these automatically — either as pre-detected Issues or through on-demand diagnostic tasks.
- You didn’t need
kubectl. The AI Assistant found the right diagnostic tasks, ran them, and presented structured findings — all from a natural language prompt in Workspace Chat. - Code errors are isolated. When only one service is crashing and the error is in the application logs, you’re dealing with a code bug, not an infrastructure problem.
Troubleshooting Pattern: Code Errors
The pattern: Pod in CrashLoopBackOff → Check Logs → Is it an exception or error in app code? → If yes: Fix Code or Rollback. If no: Check Config / Resources.
Next Steps
Ready for a more nuanced investigation? In the next scenario, the code is fine — but the Kubernetes health checks are misconfigured.
→ Next: Scenario 2: Misconfigured Readiness Probes (Test)
View Live Chat Export: Scenario 1 — Crashing Code Deploy (Dev) — View the full AI conversation, diagnostics, and findings