Issues are findings raised by automated background tasks that signal something in your environment needs attention. The Issues view provides a centralized place to review, investigate, and manage these findings.
Accessing the Issues View
The Issues view is the default landing screen when you open a workspace. It's accessible from the left sidebar by clicking the chat bubble icon. The view shows "Issues (N)" at the top, where N is the total count of open issues across all SLXs.
Issues List
The Issues list displays all open findings detected by background tasks, sorted by recency.
What Each Row Shows
Each row in the list represents an SLX with issues:
|
Element |
Description |
|---|---|
|
Status icon |
Blue circle indicates active monitoring. Different shading indicates severity. |
|
SLX Name |
The Service-Level eXperience that detected the issue (e.g., "Checkoutservice Deployment Health") |
|
Resource path |
Full path: |
|
Issue count |
How many individual issues are grouped under this SLX (e.g., "2 issues") |
|
Last seen |
Time since the most recent occurrence (e.g., "Last 12m ago") |
|
Expand arrow |
Click to see individual issues within the SLX |
Filtering and Search
-
Search bar ("Find...") — Filter issues by name or resource path
-
Status dropdown ("Open Issues") — Toggle between open, resolved, or all issues
-
Refresh button — Manually refresh the issues list
Example: Issues in the Sandbox
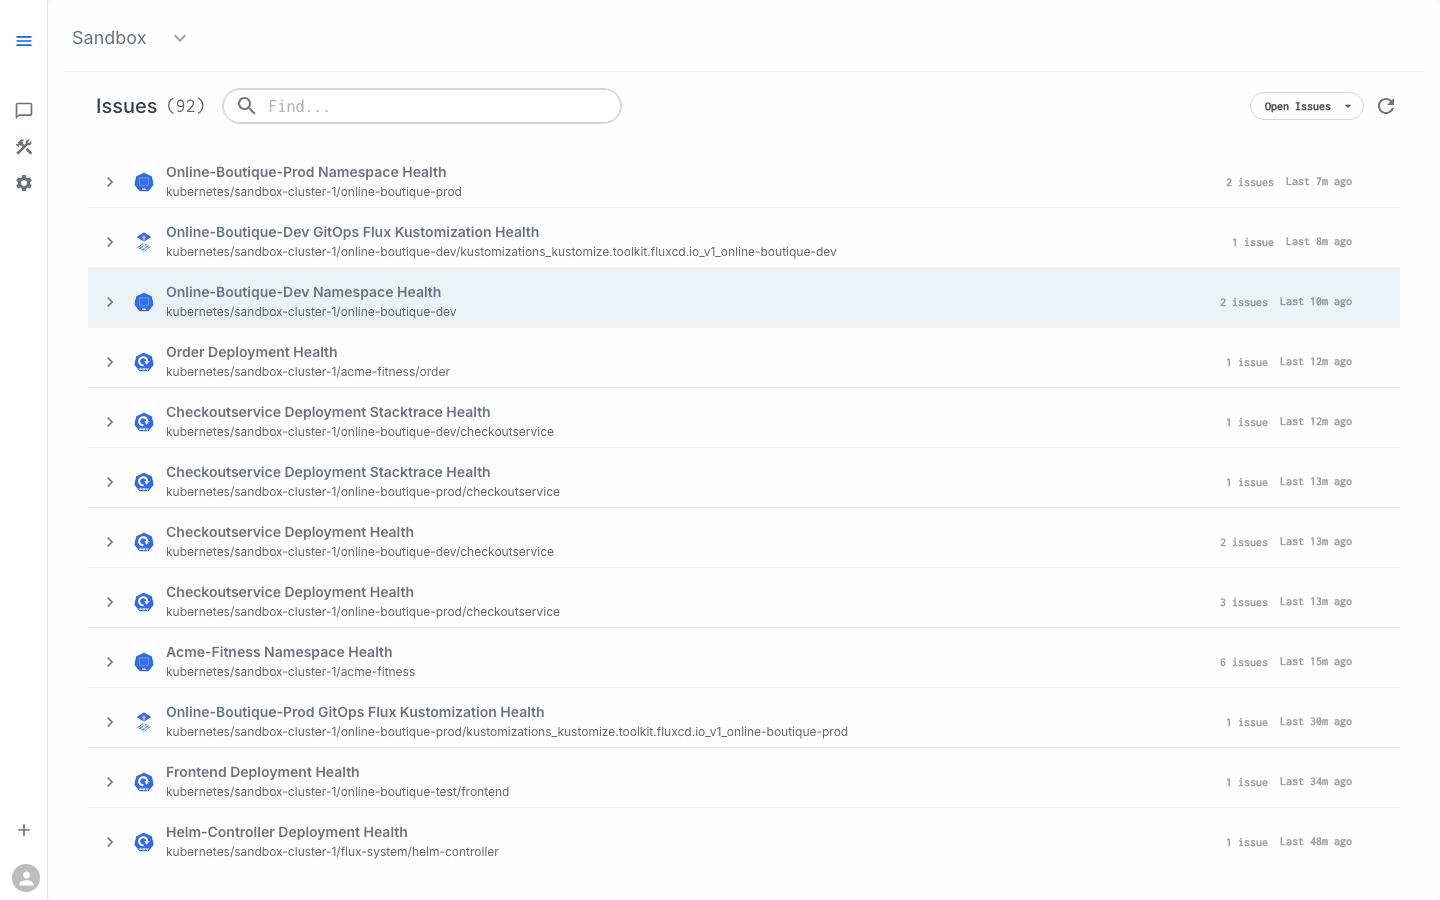
The Sandbox workspace typically shows issues like:
-
"Online-Boutique-Prod Namespace Health" — 2 issues
-
"Online-Boutique-Dev GitOps Flux Kustomization Health" — 1 issue
-
"Checkoutservice Deployment Health" — across dev, test, and prod
-
"Acme-Fitness Namespace Health" — 6 issues
-
"Frontend Deployment Health" — 1 issue
Issue Detail
Click the expand arrow (>) on any SLX row to see individual issues within it.
Expanded View
Each expanded issue shows:
-
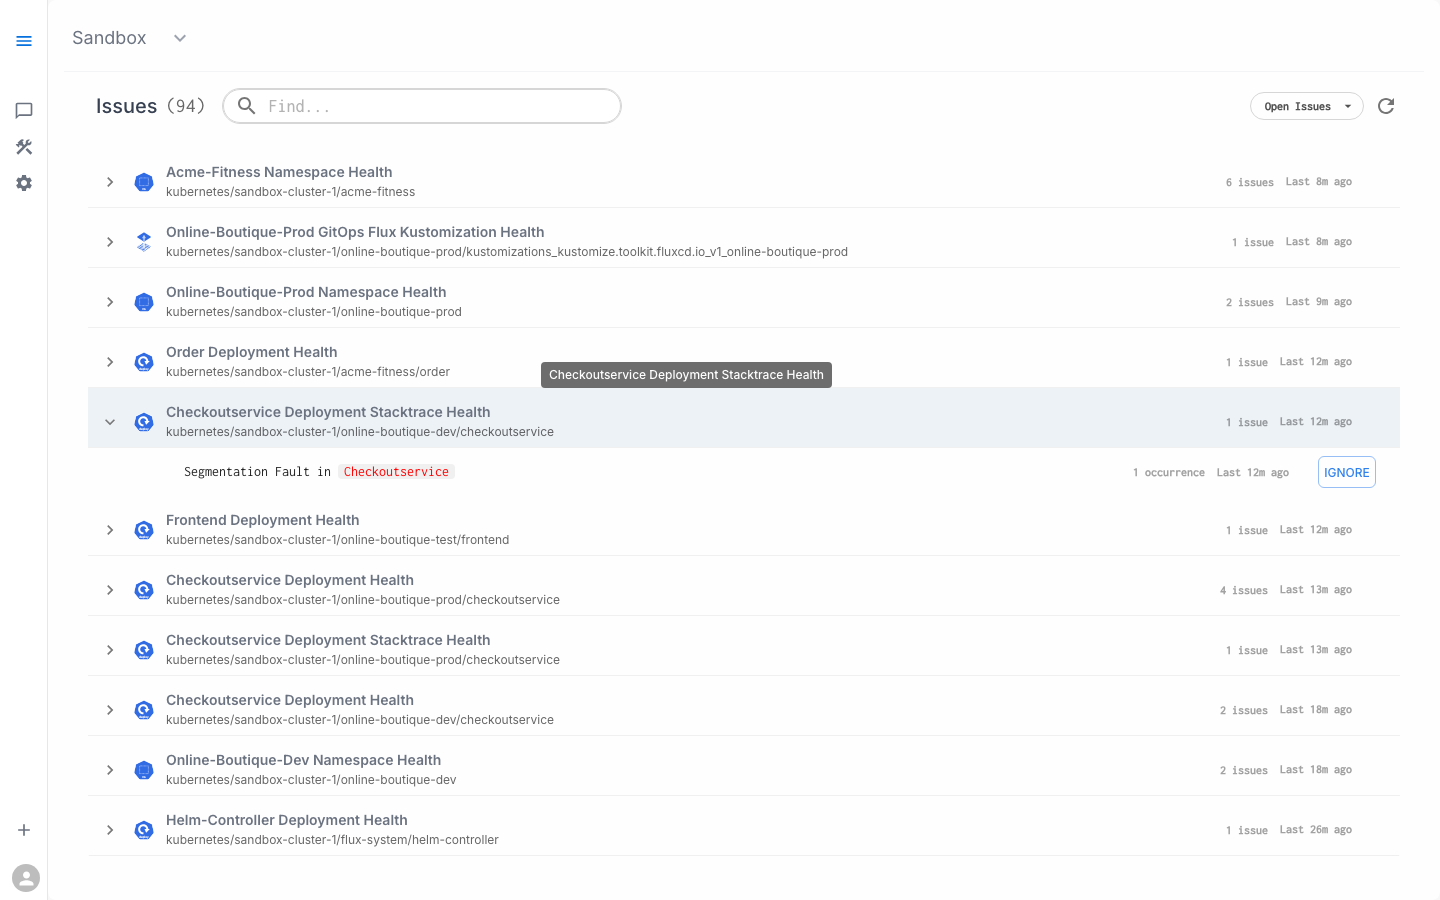
Issue title — human-readable description (e.g., "Segmentation Fault in Checkoutservice")
-
Affected resource — highlighted in red when critical (e.g.,
Checkoutservice) -
Occurrence count — how many times detected (e.g., "1 occurrence")
-
Last seen — when most recently detected
-
IGNORE button — red outlined button to suppress this issue
Issue Properties
Issues created by CodeBundle tasks include:
|
Property |
Description |
|---|---|
|
Severity |
1 = Critical, 2 = Major, 3 = Minor, 4 = Informational |
|
Title |
Human-readable description displayed in the UI |
|
Details |
Evidence and command output explaining why the issue was raised |
|
Reproduce Hint |
The command or action that generated the finding |
|
Next Steps |
Suggested actions to investigate or resolve |
Triaging Issues
Option 1: Investigate in Workspace Chat
The fastest way to investigate an issue is through Workspace Chat:
-
Note the issue title or resource name from the Issues list
-
Click the chat bubble icon to switch to Workspace Chat
-
Ask about it: "What's wrong with checkoutservice in dev?" or "Tell me about the segmentation fault"
-
The Assistant automatically finds the related issue, runs additional diagnostics, and presents a full analysis with remediation steps
Option 2: Ignore Known Issues
For expected or acceptable issues (e.g., during a maintenance window, or a known condition), click the IGNORE button on the expanded issue. Ignored issues:
-
Won't appear in the open issues list
-
Won't be surfaced by Assistants during investigations
-
Can be un-ignored later if needed
Option 3: Escalate
Issues include an escalation workflow:
-
Click the issue to view details
-
Use the escalation action to notify the service owner
-
The escalation includes all issue details and diagnostic context
Issue Lifecycle
|
State |
Description |
|---|---|
|
Detected |
A background task identifies a problem and raises an issue |
|
Open |
The issue appears in the Issues list with status icon |
|
Investigated |
A user or Assistant investigates via Workspace Chat |
|
Resolved |
The underlying problem is fixed; the issue clears on the next task run |
|
Ignored |
The issue is manually suppressed |
Issues automatically resolve when the underlying condition clears. You don't need to manually close them — the next scheduled task run will verify the condition and remove the issue if it's resolved.
How Issues Integrate with Workspace Chat
When you ask the Assistant about a namespace or service, it automatically checks for existing issues:
-
"What's unhealthy in online-boutique-dev?" → The Assistant cites open issues for that namespace
-
It reports: "citing: 20 issues and 7 resources"
-
The response references specific issues and their severity
-
You can drill into specific issues with follow-up questions
This means you don't need to manually browse the Issues list for every investigation — the Assistant integrates issue data into its analysis automatically.
Common Issue Patterns
|
Pattern |
Typical SLX |
What to Look For |
|---|---|---|
|
Pod crashes |
Deployment Health |
CrashLoopBackOff, OOMKilled, segfaults |
|
Configuration errors |
Deployment Health |
Misconfigured environment variables, wrong service addresses |
|
GitOps drift |
Flux Kustomization Health |
Failed reconciliation, source mismatch |
|
Resource pressure |
Namespace Health |
Resource quota exhaustion, memory limits |
|
Connection failures |
Deployment Stacktrace Health |
Database connection errors, service timeouts |
Screenshots
Issues list — showing open issues grouped by SLX
Issue detail — expanded view showing individual issues and IGNORE button