Release Readiness: The Slash Command That Replaced Our Pre-Release Checklist
This is the first post in our Favorite Slash Commands series, where we walk through the commands our team uses daily against our real environment.
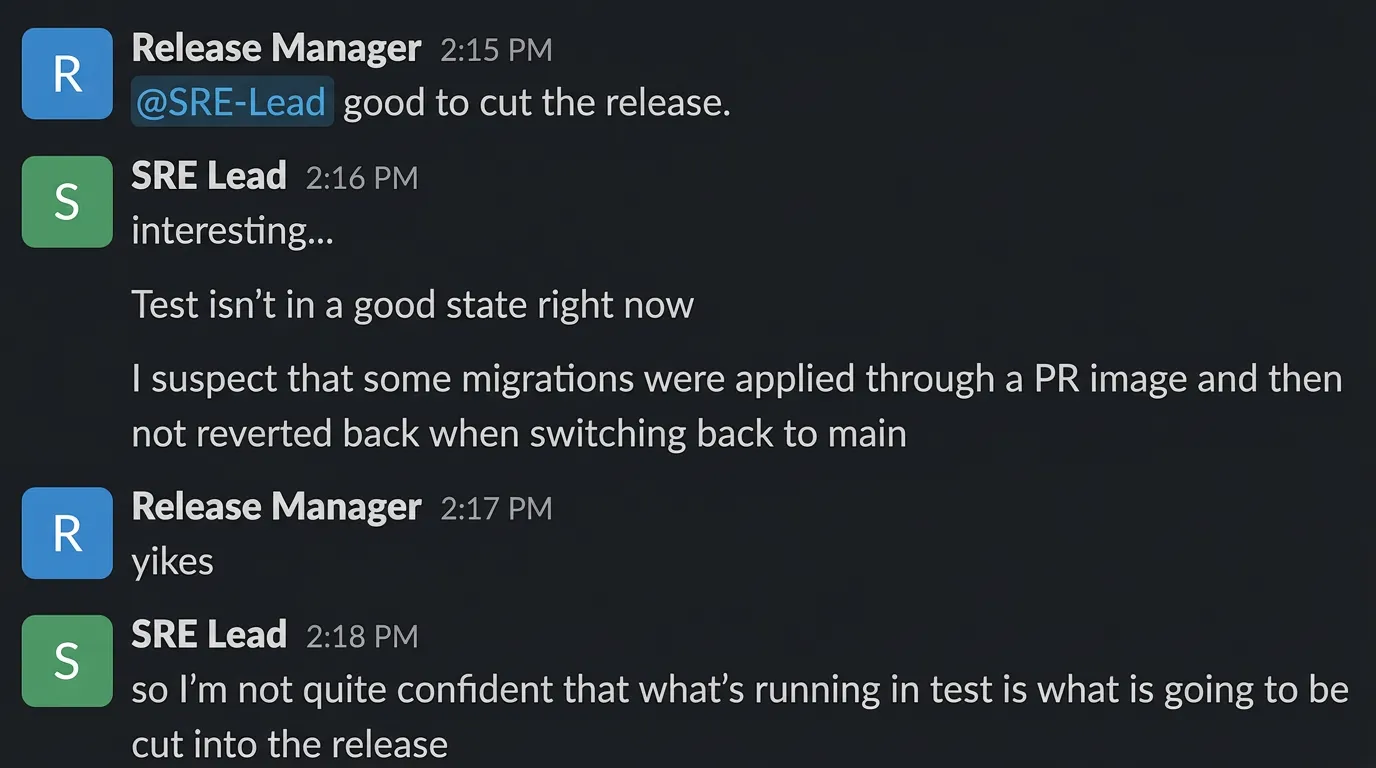
The question every release manager asks
Before promoting a release to the next environment, someone on the team asks: “Are we good to ship?”
That question sounds simple. Answering it is not. The person asking needs to know:
- Are there open issues? Which ones matter?
- Is the current build stable? How long has it been running?
- Did anything break since the last deploy?
- Are the GitOps pipelines healthy?
- Is the database connection pool clean?
- Did a wave of issues firing an hour ago leave residual damage?
- Are the image tags actually current, or is test running stale code?
Historically, this was a 15-minute ritual of checking dashboards, scrolling through Slack, and asking the senior SRE “does anything look off?”
We replaced it with a slash command.
The command
Here is the full text of /mgr-release-readiness — the actual natural language instruction set that our assistant follows:
# Release Readiness — Go/no-go assessment
A manager needs to decide whether to promote a release to the next environment.
## Steps
### 0. Pre-check: Latest Main Deployed?
Before assessing the release, first verify the test environment has the latest code:
- **Run `w-test--verify-main-image-tags`** to check that the configured image tags  in test match the latest `main` commit for each repo (468-platform, agentfarm, usearch).- If any tags are STALE, the release readiness assessment should be **NO-GO**  until image tags are updated.
### 1. Identify the release
Which release tag and which promotion (test→watcher or watcher→beta)?
### 2. What's in the release
High-level summary of changes:- Features added- Bugs fixed- Infrastructure changes- Any breaking changes or required config updates
### 3. Stability assessment
- How long has the release been in the current environment?- Open issues count (severity 1-2 = blockers, severity 3 = review, severity 4 = acceptable)- Any issues that appeared AFTER this release was deployed?- Flux reconciliation status
### 4. Risk factors
- Does this release include backend behavioral changes? (higher risk)- Does it touch the critical path (papi, pgbouncer, modelsync)?- Does it include FastAPI migration changes?- Are there new configuration requirements?
### 5. Recommendation
Provide a clear go/no-go:- **GO**: No sev 1-2 issues, stable for > 2 hours, Flux healthy, all image tags current- **GO WITH CAUTION**: Sev 3 issues present but manageable, backend changes need monitoring- **NO-GO**: Sev 1-2 issues open, Flux failing, critical services unstable, or image tags stale
### 6. Next steps
- **If GO** — Run `/generate-release` to start the release generation process.- **If NO-GO** — List blocking items and expected resolution timeline.
That is the entire command. No code. No API calls. No YAML. Plain English instructions that any team member can read and modify.
Notice step 0 references a specific task by name — w-test--verify-main-image-tags. We added that task just this week. It checks that the running container images across our three main repos (468-platform, agentfarm, usearch) match the latest main commit. Before it existed, image tag verification was a manual check. Adding it to the command was a one-line edit: we just referenced the new task name. The assistant picks it up on the next run.
When the process changes — say we add a new pre-flight check or change the stability window from 2 hours to 4 — someone updates the text. The assistant adapts immediately.
What happened when we ran it today
We typed /mgr-release-readiness into Workspace Chat against our test workspace on April 10, 2026. The moment you hit enter, the assistant starts working:
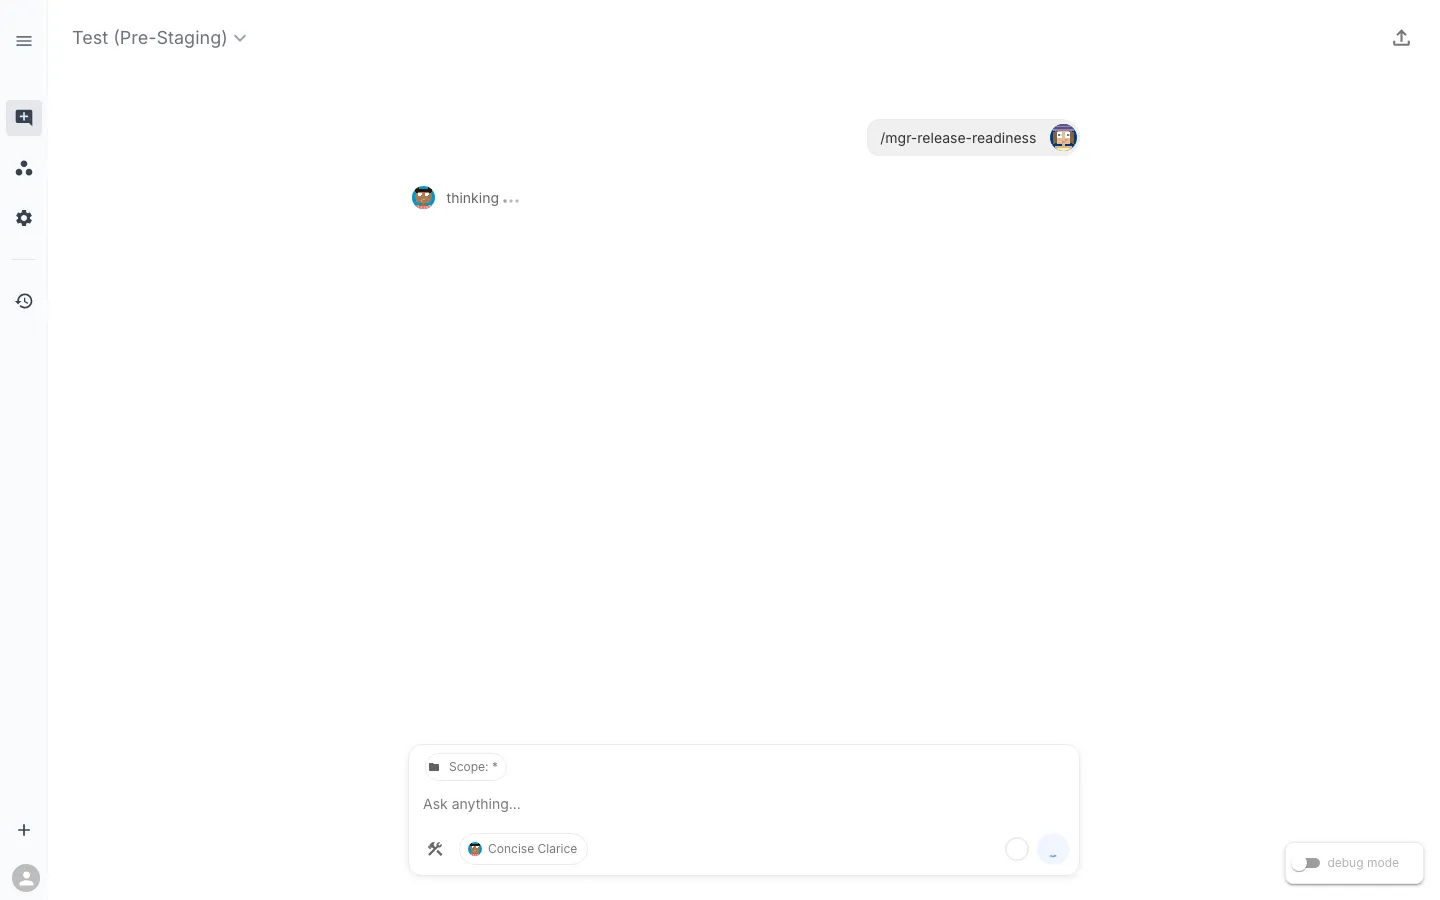
Here is the assistant working through the assessment in real time:
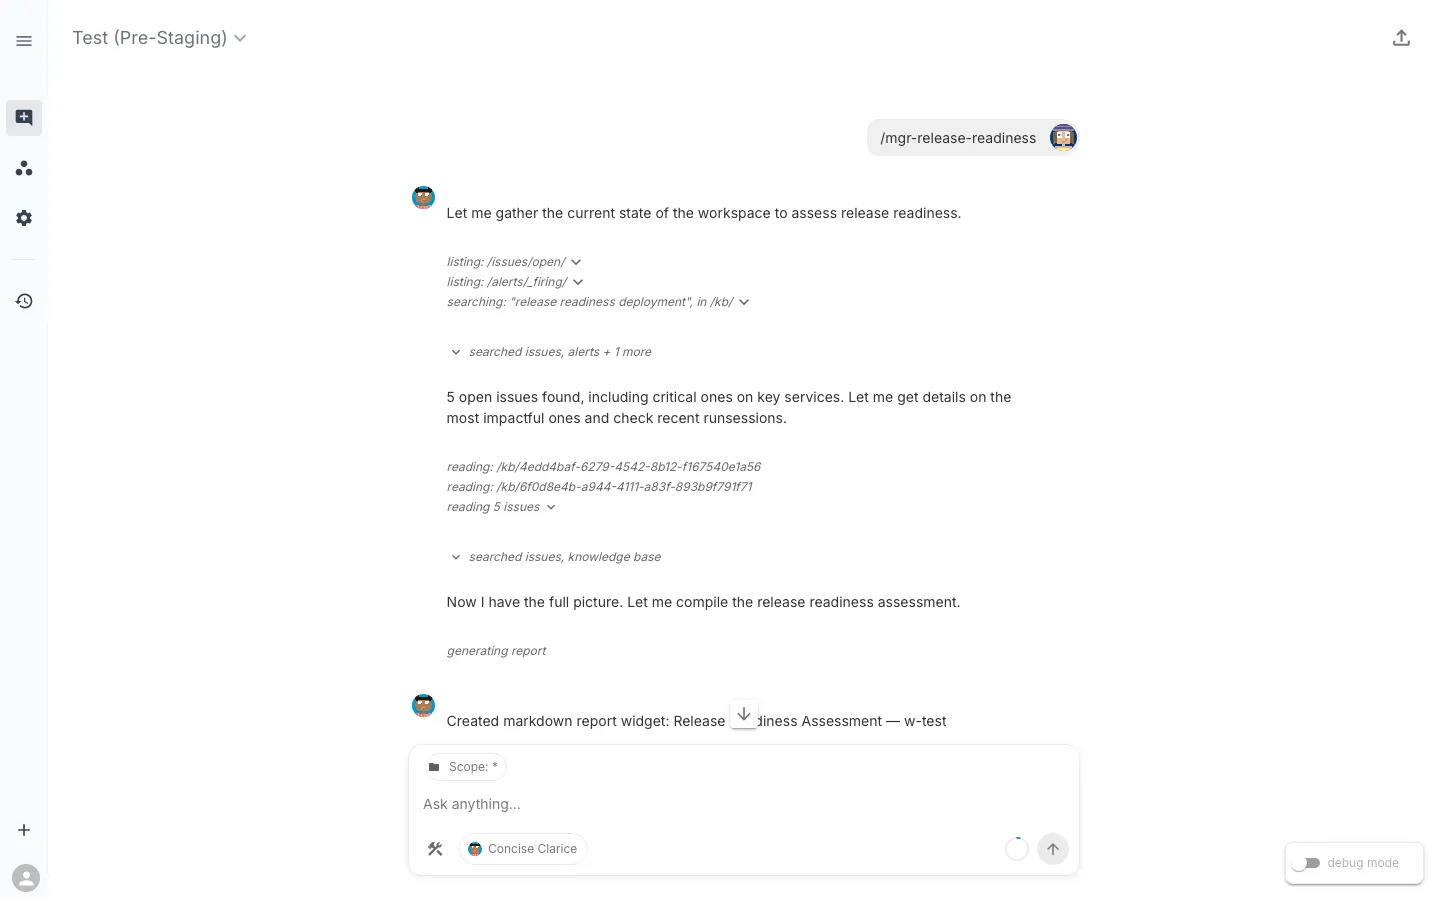
The assistant starts by listing open issues, checking for firing alerts, and searching the knowledge base for release readiness context. It finds 5 open issues including critical ones on key services, then drills into each one, reads the knowledge base, and checks recent RunSessions — all autonomously, guided by the command’s instructions.
After about 50 seconds of investigation, it produces a structured verdict:
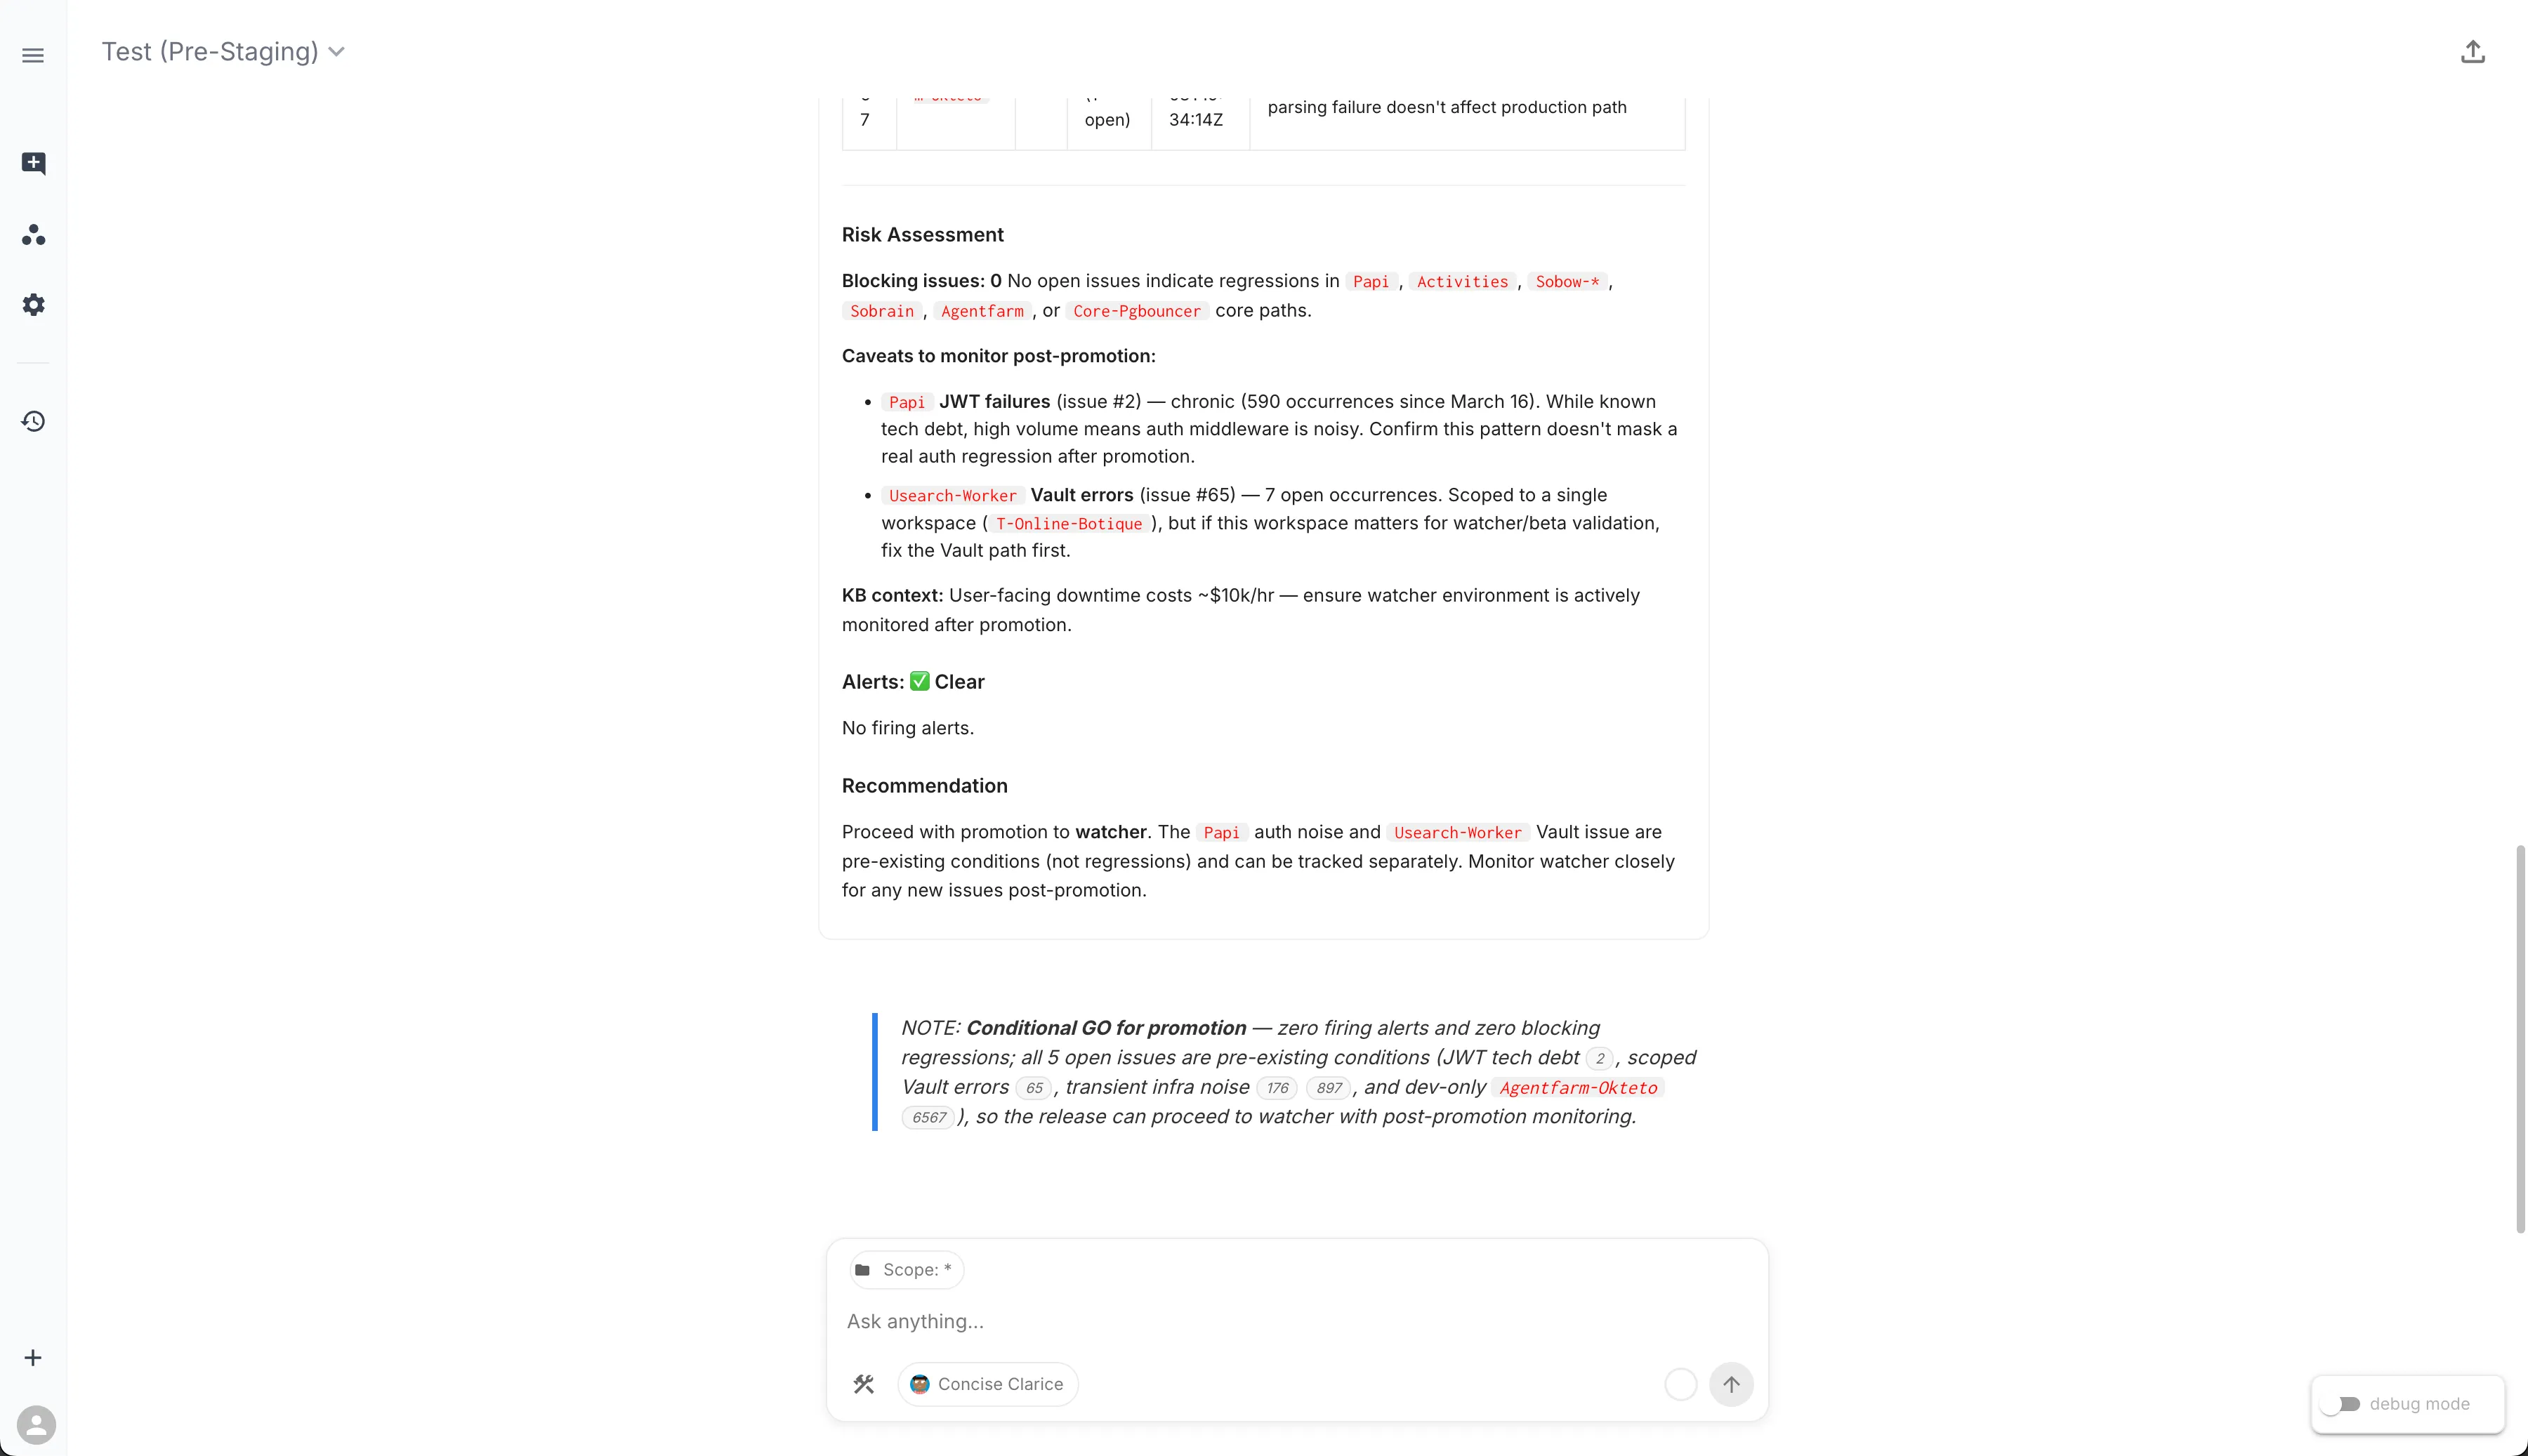
The verdict: Conditional GO for promotion. Zero firing alerts, zero blocking regressions. All 5 open issues are pre-existing conditions — JWT tech debt, scoped Vault errors, transient infrastructure noise, and a dev-only deployment — none introduced by the current release. The assistant cites each issue by ID so you can click through to the details.
The collapsed “Release Readiness Assessment” widget contains the full structured report — a table of every open issue with its severity, namespace, occurrence count, and release impact classification. You can expand it for the detailed view or share the chat session with your team via the export link.
What stands out: the assistant did not just list issues. It triaged each one against the release timeline, classified them by impact, checked whether a wave of issues earlier in the day left residual damage (it did not), and routed the one item that needed human judgment — a Flux kustomization failure — to the right person by name.
More than metrics and logs
Traditional SRE monitoring focuses on MELT signals — Metrics, Events, Logs, and Traces. Those are essential, and our tasks absolutely use them. A good chunk of what the assistant evaluated falls squarely into MELT territory: SLI health scores, SLO error-budget burn rates, application log pattern detection, stacktrace extraction, pod resource utilization, event anomaly detection. These are bread-and-butter observability signals and they provide critical input to the readiness assessment.
But answering “is this release ready to promote?” requires context that does not come from a metrics backend or a log aggregator. The workspace currently has over 600 SLXs spanning hundreds of task types, and when you step back and look at what those tasks actually examine, several categories sit outside what MELT covers:
Kubernetes object state — Replica counts, probe configuration, PersistentVolumeClaim health, PodDisruptionBudget coverage, node scheduling pressure. This is not telemetry; it is the declared-vs-actual state of the cluster, read directly from the Kubernetes API.
Configuration and change detection — Which container images were recently updated, what ReplicaSets exist, whether resource limits have drifted. These are facts about what changed, not signals about how things are performing.
GitOps and delivery pipeline — FluxCD HelmRelease reconciliation status, version drift between installed and available Helm charts, kustomization controller errors. Your CI/CD pipeline’s health is not a metric you scrape — it is a state you query.
Security and access — Certificate expiration, failed certificate requests, service account API access, Vault credential availability. These are binary pass/fail checks that do not produce time-series data but absolutely matter for a release gate.
Database operations — PostgreSQL cluster health via Patroni, replication lag, backup verification, connection pool status. Some of this overlaps with metrics, but the cluster management state (failover readiness, member health) comes from the database operator, not Prometheus.
The point is not that MELT is insufficient — it is that the question requires more. A Grafana dashboard gives you excellent visibility into how your services are performing. But “is this release ready?” also needs to know whether Flux is reconciling, whether certificates are expiring, whether the right image tags are deployed, and whether a Vault path is misconfigured. The assistant combines all of it because the tasks in the workspace span all of it.
The tasks behind the report
To give a sense of the breadth, here are the major task categories across the workspace:
| Category | What they check |
|---|---|
| Workload health | Replica status, container restarts, probe config, log patterns, event anomalies, HPA health across Deployments and StatefulSets |
| Application logs | Error signatures, stacktrace extraction, log anomaly detection |
| Container images | Rollover times, running vs. failed images, ImagePullBackOff, image tag currency against main |
| Namespace health | Pending/failed pods, warning events, workload conditions |
| Resource sizing | Utilization vs. requests, VPA recommendations |
| GitOps | HelmRelease status, version drift, Flux reconciliation errors |
| Certificates | Unhealthy certs, failed requests, expiration |
| Storage | PVC utilization, terminating volumes, node attachment |
| Database | Connection health, Patroni status, backup verification, replication lag, PgBouncer pool health |
| Access control | Service account API access verification |
| HTTP endpoints | URL reachability and timing |
| Search infrastructure | USearch worker health, indexing job status, Neo4j index integrity, queue staleness |
| Platform integrity | Orphaned SLX child detection, worksync sync health, PAPI availability |
| CI/CD | GitHub Actions workflow dispatch, image tag verification against latest main |
This list keeps growing. Just this week we added the verify-main-image-tags task that the command’s step 0 references. The workspace also recently gained a cluster of USearch observability tasks (worker diagnostics, indexing job health, Neo4j index integrity, queue staleness) and a platform integrity check that detects orphaned SLX children before they cause workspace validation failures.
The assistant navigated all of it in under a minute to produce a structured go/no-go recommendation.
The command is just natural language — and that is the point
Most of the command is pure intent — “check Flux reconciliation status,” “assess open issues by severity” — without referencing specific tasks. The assistant resolves which SLXs to query at runtime based on what is actually deployed in the workspace. Step 0 is the exception: it names a specific task because we want the assistant to run that exact pre-flight check every time. Both patterns work, and you choose based on how prescriptive you want to be.
This means:
- When tasks change, the command does not break. If we add a new CodeBundle or rename an SLX, the assistant finds the updated tasks on the next run.
- Anyone can modify the command. Adding “also check Redis cluster health” is a one-line text edit. No PR, no deploy, no code review.
- The command adapts to the workspace. The same
/mgr-release-readinesscommand running in a different workspace with different infrastructure would use whatever tasks are available there.
Related commands in the release workflow
/mgr-release-readiness does not exist in isolation. It is one step in a chain of commands that cover the full release lifecycle:
| Step | Command | Purpose |
|---|---|---|
| 1. What is deployed? | /release-status | Check current image tags across environments |
| 2. What changed? | /dev-whats-changed | Summarize the release diff by area |
| 3. Ready to ship? | /mgr-release-readiness | Go/no-go assessment |
| 4. Infra sign-off | /mgr-release-readiness-infra-review | SRE team’s infrastructure-focused review |
| 5. Generate release | /generate-release | Trigger the release workflow with pre-flight checks |
| 6. Promote | /sre-promote-release | Step-by-step environment promotion guide |
Each command references the others. The readiness assessment’s “Next Steps” section says “Run /generate-release if GO” — and the generate-release command’s pre-flight checks include “Run /mgr-release-readiness first.” They compose naturally because they are all operating against the same workspace state.
What else could a slash command assess?
Release readiness is one pattern. But the underlying principle — an AI assistant synthesizing signals across domains to answer a high-level question — applies to questions that most teams are still answering manually:
- Capacity planning reviews — “Do we have headroom for Black Friday traffic?” Drawing on resource utilization, HPA limits, node capacity, and storage growth trends.
- Compliance posture checks — “Are all certificates valid, RBAC policies current, and network policies enforced?” Combining cert-manager state, service account audits, and ingress configuration.
- Cost optimization reviews — “Where are we over-provisioned?” Using VPA recommendations, pod utilization vs. requests, and idle replica detection.
- Dependency health audits — “Are all upstream services healthy before we deploy a consumer?” Checking HTTP endpoints, database connectivity, and message queue depth across service boundaries.
- Migration progress tracking — “How much of the Django-to-FastAPI migration is in production?” Comparing running image tags, endpoint parity, and error rate differentials between old and new paths.
The common thread: these are questions that span multiple domains, require correlating signals that traditionally live in different tools, and benefit from a structured investigation procedure that produces a consistent, shareable output.
Metrics and logs are an essential part of every one of these investigations. But the full answer comes from combining them with configuration state, pipeline health, security posture, and operational context — something an assistant can do in seconds because the tasks already exist in the workspace.
This post is part of the Favorite Slash Commands series. Next up: What Changed? — the command developers run first when they need to understand what just shipped.