

The Scheduled Agents We Run, With the Prompts
In July we published How RunWhen Uses RunWhen, a screenshots-first tour of how our engineers use RunWhen Agents from on-call triage to FinOps. This post goes deeper on the pattern behind many of those examples: scheduled Agents. Same format, plus the prompts.
A scheduled Agent is a saved Agent prompt that runs on a schedule. Results land in email, Slack or Teams with follow-up buttons that drop the reader into a chat session, where they can ask questions or build a ticket, diagram or write-up.
We use them to grow in scope faster than we grow in headcount, with Agents filling specialist roles under the direction of our senior engineers. They report on storage capacity, post-release infrastructure trends and certificate expirations, and they have replaced most of our dashboards. Each application team gets “full stack” health coverage, from HTTP performance through logs and database metrics down to infra capacity, the way an embedded Infra/DevOps/SRE engineer would provide it. We even run one for business intelligence on user activity from our databases.
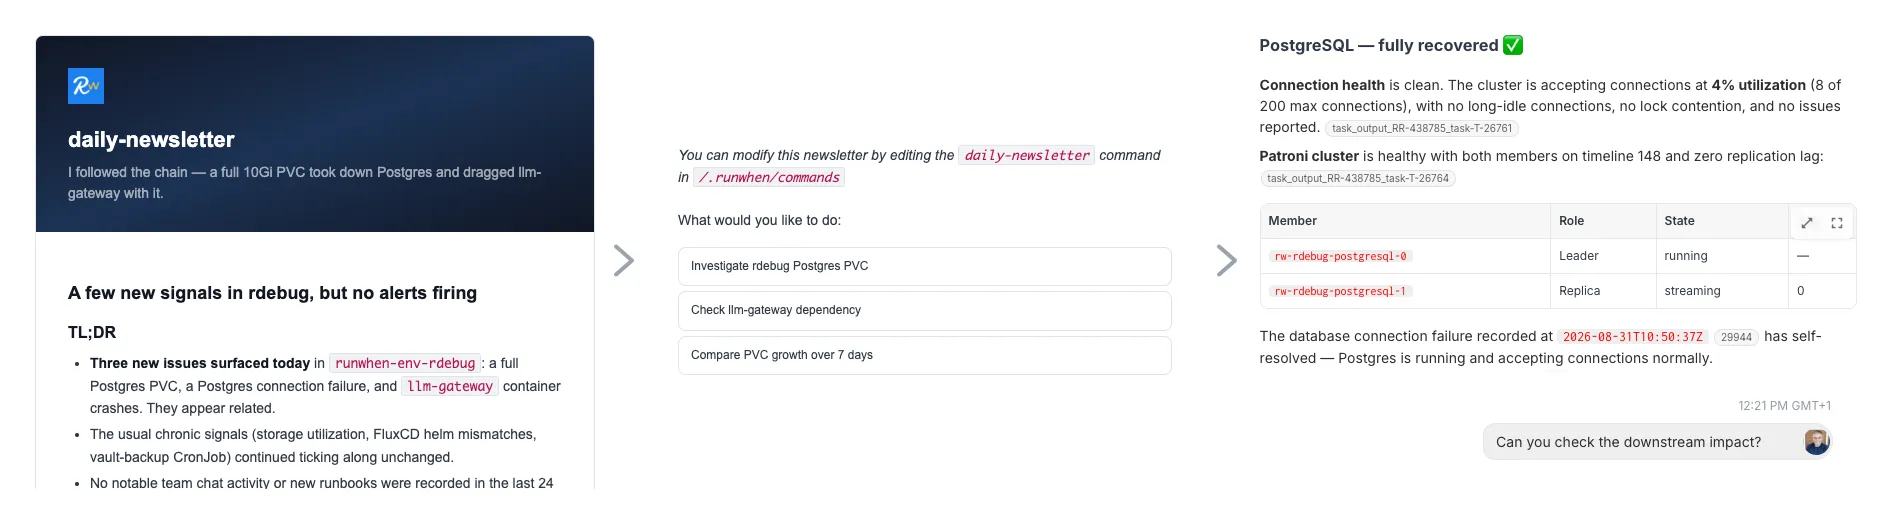
A daily newsletter from a RunWhen Agent: a TL;DR of new signals, follow-up buttons for the likely next questions, and the chat session one of them opens.
The daily update is the most important part of onboarding. Clicking a follow-up button is the single most successful user journey we have for bringing a broader team onto RunWhen beyond the first few admins.
Building a good scheduled Agent
- Scheduled Agent = scheduled prompt + tasks + delivery. Build your first few with tasks already installed in the workspace. Once those run, add tasks for new content.
- Get the Agent to write the final prompt. In chat, ask “brainstorm a detailed prompt with me,” or after a useful session, “write a one page prompt for me that replicates what we have done in this session.” RunWhen Agents know every tool they have, so they write better prompts for themselves than a human does.
- Collect context, then fill a template. The most effective prompts do two things: collect context (from the Agent’s memory of Tasks and Issues, fresh Task runs, or both), then format it into a template included in the prompt. Logic in between, especially
for each ___, do ___, is more reliable as a custom task than as LLM instructions. - Ask for recommendations, priorities and a TL;DR. Good models produce useful prioritized lists with surprisingly little strict logic. Let readers click through for complete lists.
- End with suggested next steps. The follow-up buttons are often the most powerful part of the report, and they let the output stay brief.
DevSecOps favorites
Vulnerability Recommendation Report
Our original vulnerability report showed current CVE counts from Trivy scans. It led to too many questions from DevSecOps back to developers asking whether something was fixed. The new one carries CVE counts and the relevant open PRs, so both teams see new CVEs and fixes in flight at the same time, plus prioritized quick actions teams can take on first- and third-party code without DevSecOps chasing them.
During the launch of a massive multi-service refactor, this report helped the team get from 37 Criticals to 0 across 8 OSS and first-party microservices in five days.
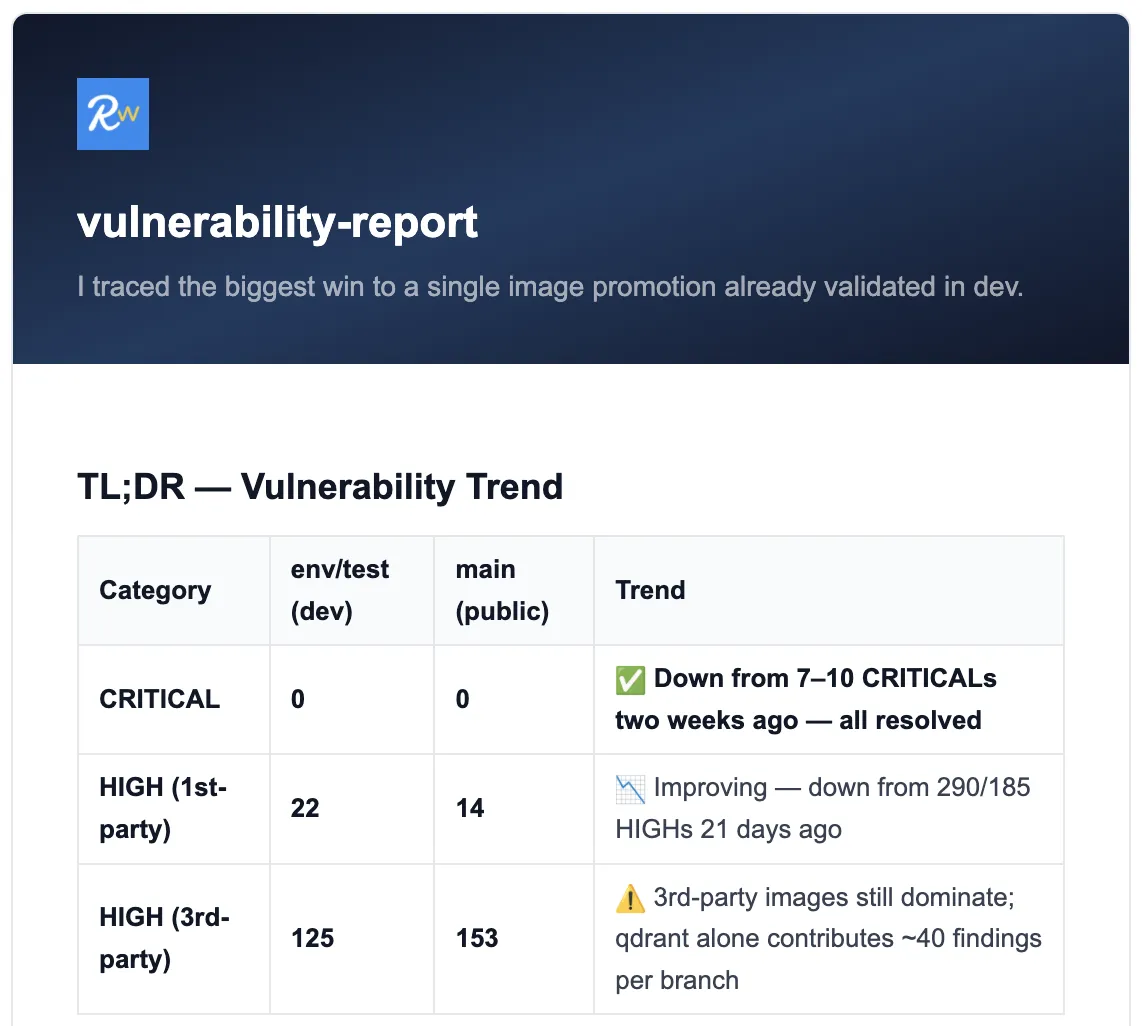
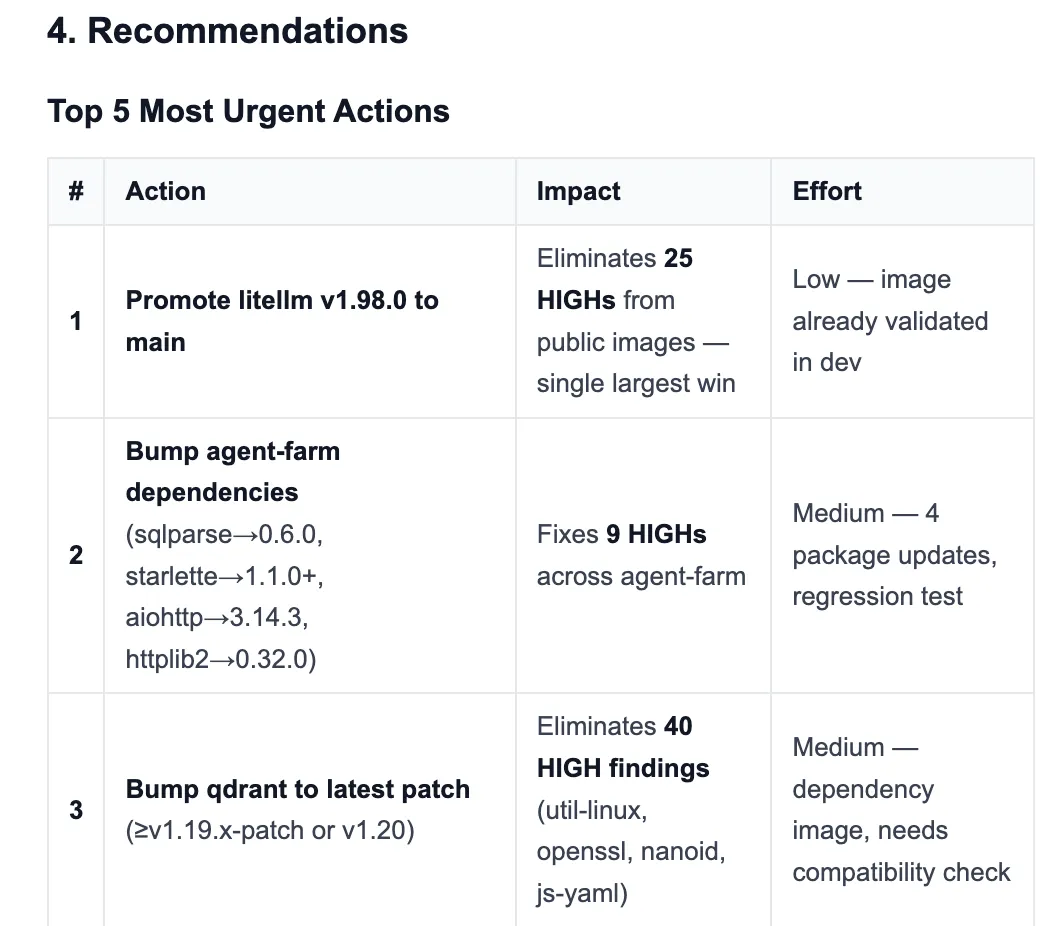
A daily vulnerability report: a TL;DR trend table by category, then the Top 5 Most Urgent Actions ranked by impact and effort, led by a single litellm image promotion that eliminates 25 HIGHs.
Full prompt
Run the following tasks to capture fresh report data:  - github-trivy-health on branches "env/test" and "env/main"  - github-dependency-prs across the default repositories
Generate a comprehensive vulnerability report following this structure:
1. Trivy Scan Comparison (env/test vs main)
First, investigate the latest trivy scan results for rwlight-helm. Fetch the github-trivy-health task runs — find the most recent issues for both the "env/test" and "main" branches. Compare the vulnerability counts and identify:
Resolved from test to main: CVEs present in env/test but NOT in mainNew in main: CVEs present in main but NOT in env/testPersistent: CVEs in BOTH branches
Group by image category:First-party: backend-services, runner-control, agentfarm, webhooks-service, usearch, shared-services, ui, ui-v2, embedder, mcpServer, ccCatalogDependencies: postgresql, redis, neo4j, vault, seaweedfs, qdrant, mimir, pgbouncer, litellm, busybox, spilo
2. Open Dependency PRs
Investigate dependency PRs across these repos:project-468/468-platformrunwhen/runwhen-runnerrunwhen/usearchrunwhen/agentfarmrunwhen-contrib/runwhen-localrunwhen-contrib/rw-base-runtime
For each repo, check the github-dependency-prs task results. List open PRs with age, title, and link. Note if the Dependency Dashboard exists.
3. CVE-to-PR Correlation
Cross-reference CVEs from section 1 with PRs from section 2:Addressed by PR: CVEs with a matching Renovate/Dependabot PR openUnaddressed CRITICAL/HIGH: CVEs with no matching PRInclude PR link and age for each matched CVE
4. Recommendations
Top 5 most urgent actions (oldest unaddressed CRITICALs first)Flag repos missing Dependency DashboardNote PRs open over 7 days without merge
Add a TL;DR at the top that includes our trend towards increased or reduced CRITICALS/HIGHS grouped by 1st party or 3rd party images.
Expiring Credentials Risk Report
Across three clouds and 22+ Kubernetes clusters, we manage several hundred certificates in first- and third-party applications and infrastructure. Most, but not all, of the vendors and open source projects in our supply chain let us automate rotation, so every environment still needs continuous monitoring.
The Agent checks several hundred credentials, notes upcoming rotations, escalates any whose automation has failed before, and flags the few that still need manual rotation.
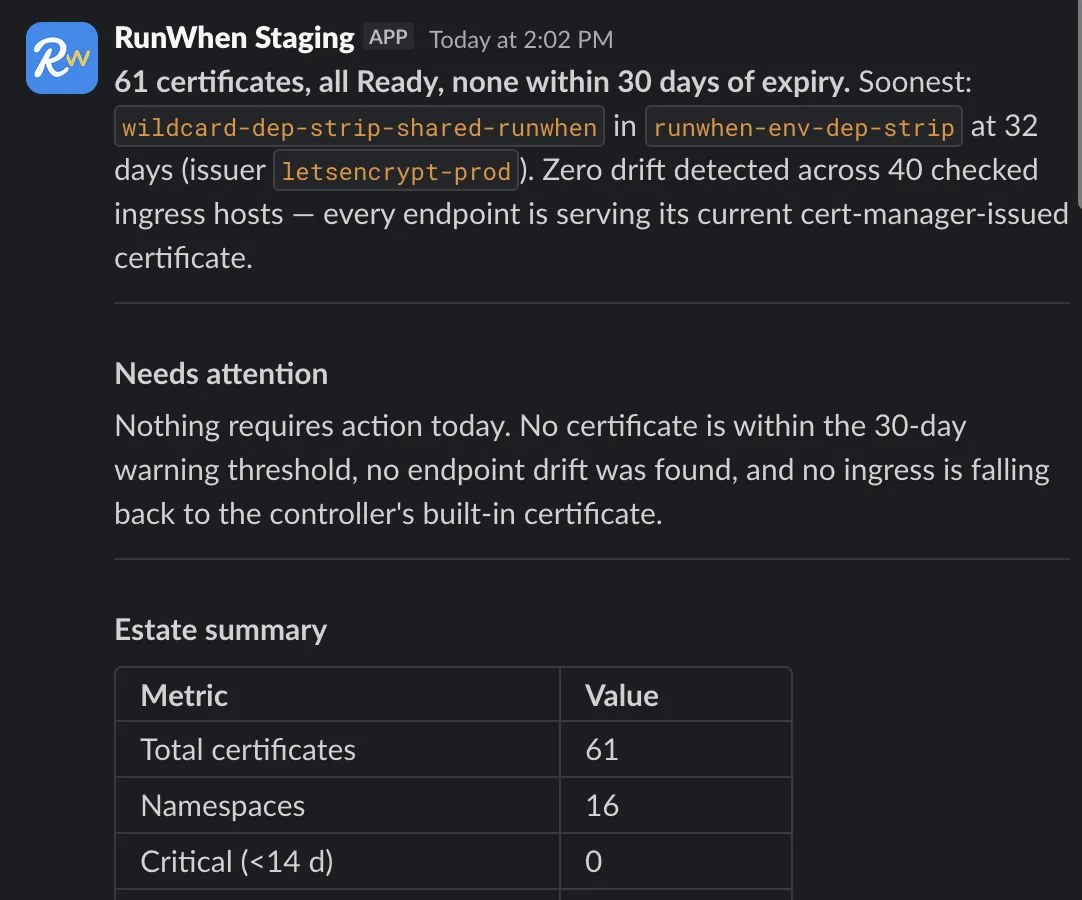
A weekday certificate report: 61 certificates, all Ready, none within 30 days of expiry, and zero drift across 40 ingress hosts. Every endpoint is serving its cert-manager-issued certificate.
Prompt (excerpt)
Produce the weekday certificate report for the shared GKE cluster. The reader is on-call: they need to know whether anything needs attention today, and if so exactly which certificate and what to do next.
Data collectionRun both breadth tasks and wait for results:/cert-expiry-horizon — the whole inventory ranked by days until expiry, with per-namespace counts./cert-served-vs-declared — whether each ingress host is serving the certificate cert-manager issued for it.…
Developer favorites
PR Review Agent
Not strictly a scheduled Agent, but so heavily used it earned a spot here. We run it for hundreds of PR reviews per week.
We have ~42 code repositories with repo-specific review Skills, plus a few Skill repositories with company-wide review Skills for security, reliability and more. Those are maintained outside our dev teams. We wanted a PR Review Agent that:
- Lets teams outside the primary dev team (security, platform, infra) review PRs with Agents and Skills they own, alongside our traditional linting and security review tools
- Leaves overview reviews with sequence diagrams, so tech leads and SRE reviewers see a PR’s architectural implications, especially new service dependencies, at a glance
- Leaves large numbers of inline comments written for coding agents to consume
- Has enough configuration options to control token costs across many reviewing Agents
- Brings context from production and test environments into the review (“SRE Review”)
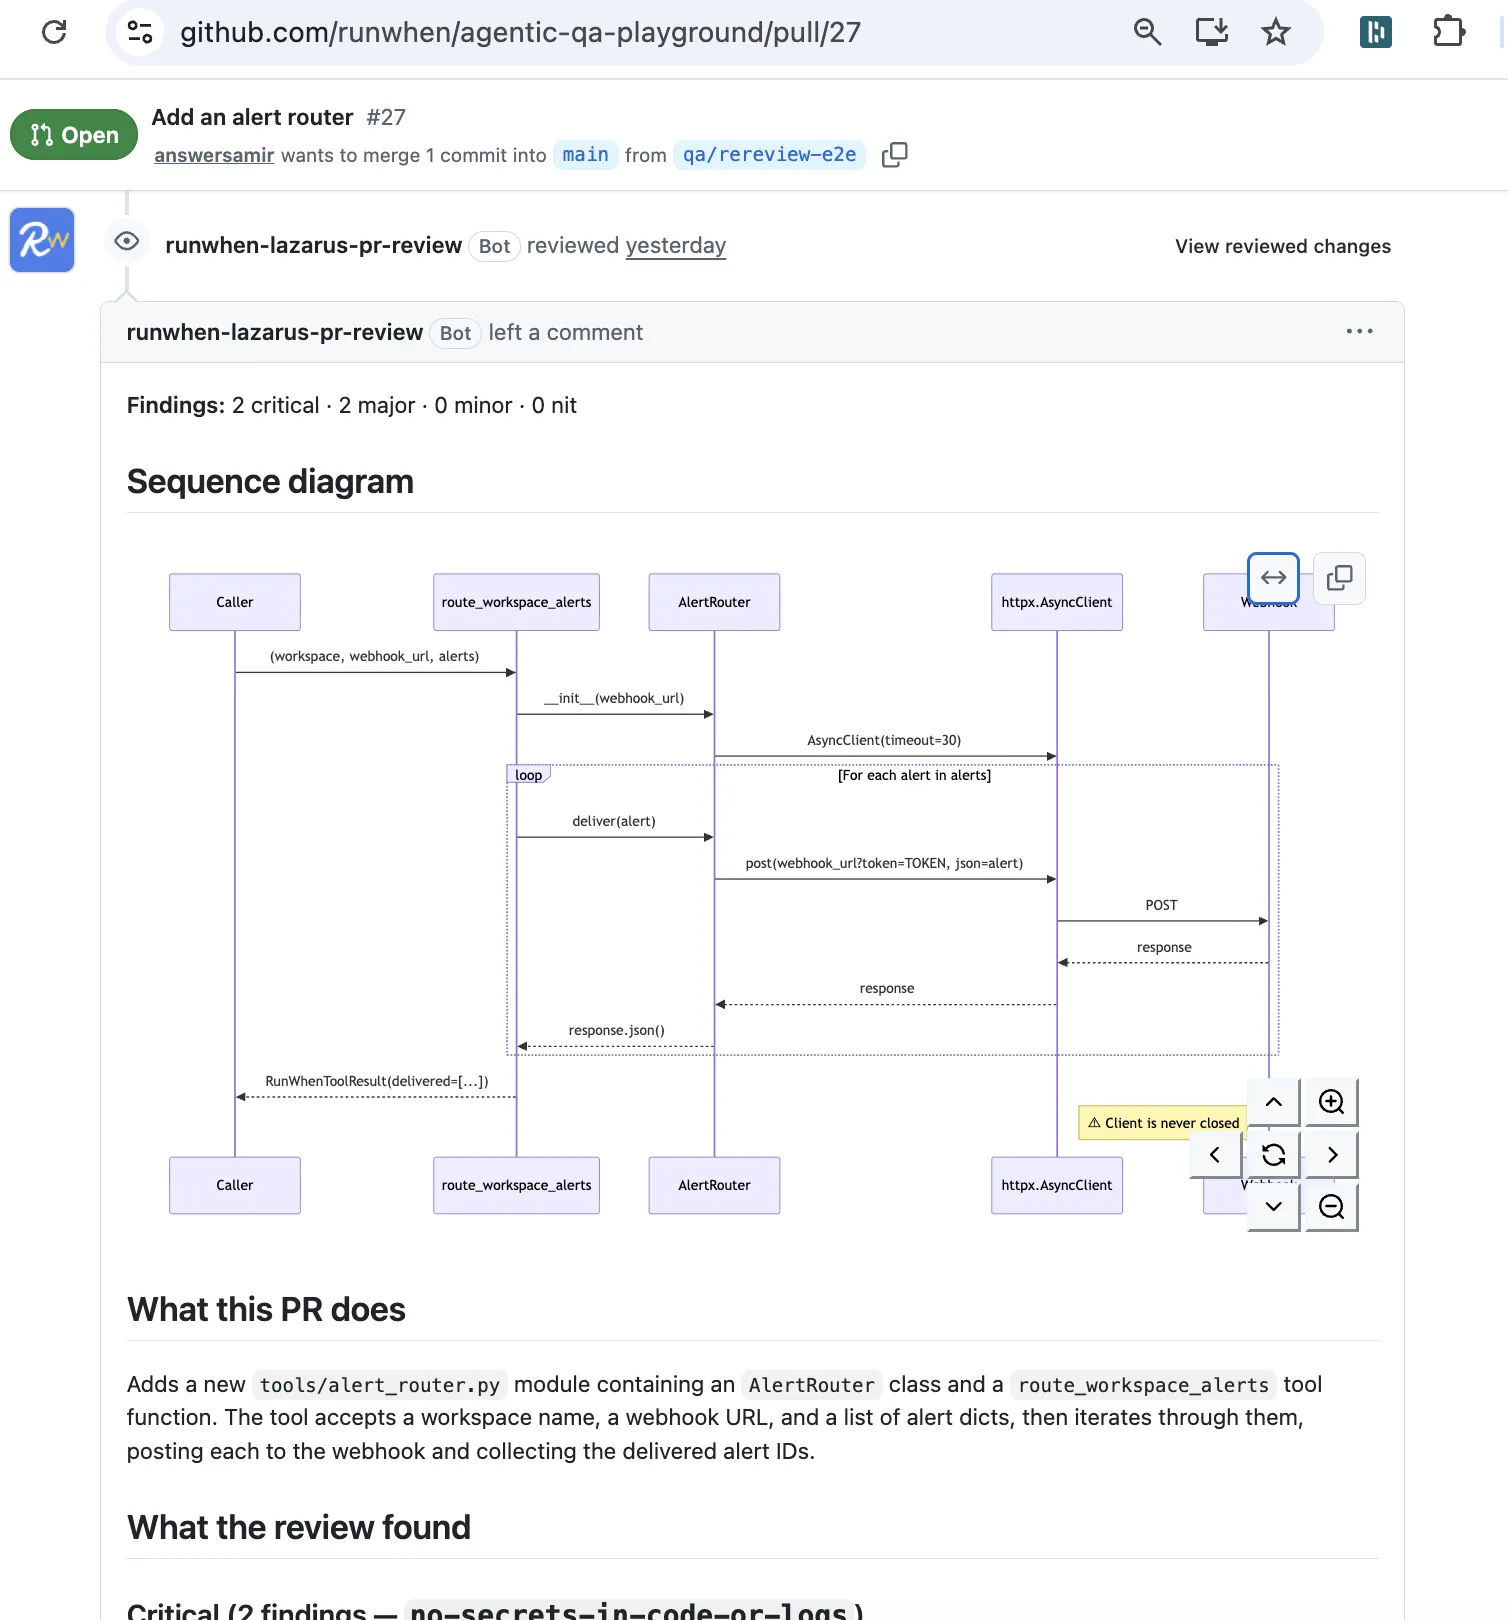
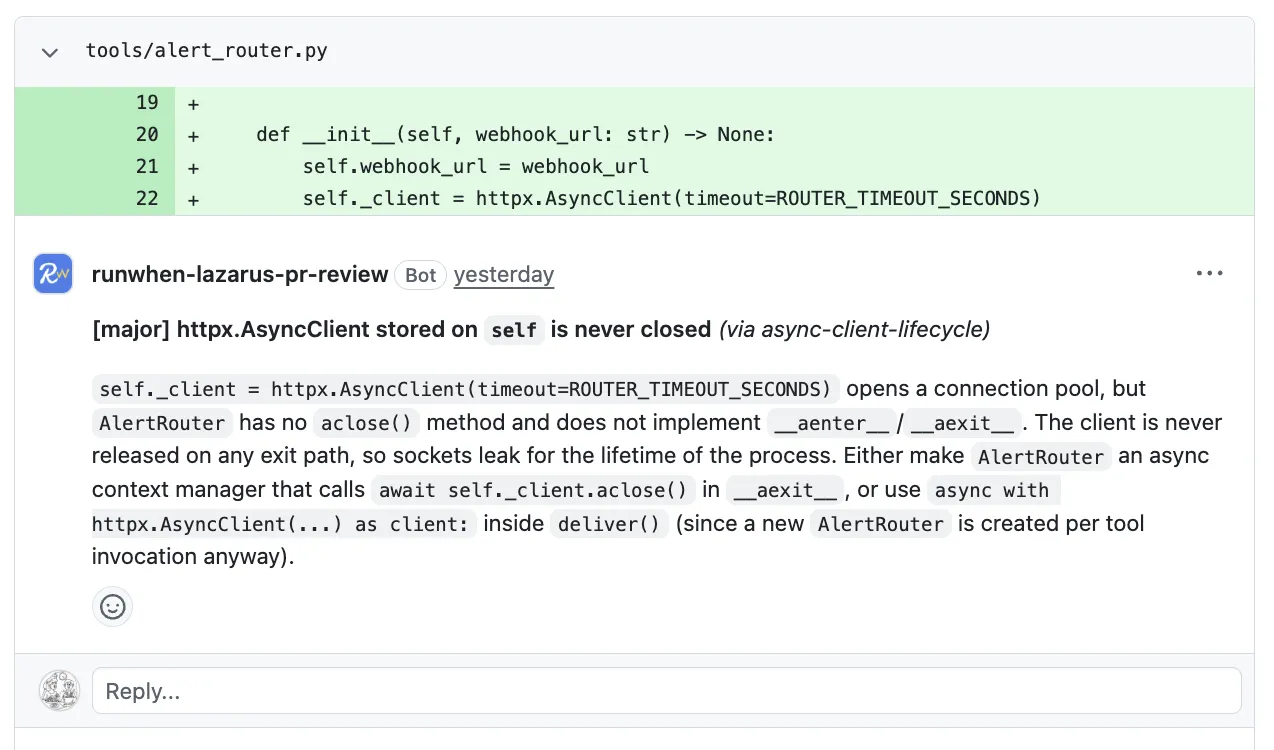
A RunWhen PR review on GitHub: 2 critical and 2 major findings, a sequence diagram of a new alert router, and an inline major finding on an HTTP client that is never closed.
SRE and platform engineering favorites
Test/Staging Environment Health Report
Holistic reports that cover application and infrastructure health in one place minimize the back-and-forth between our application and infrastructure teams. Anyone on any team can continue and share an investigation, so far more people can make progress when a dev, test, staging or production environment is down. We are increasingly comfortable that an engineer new to the team can pick up the most complicated non-prod issues with no extra context.
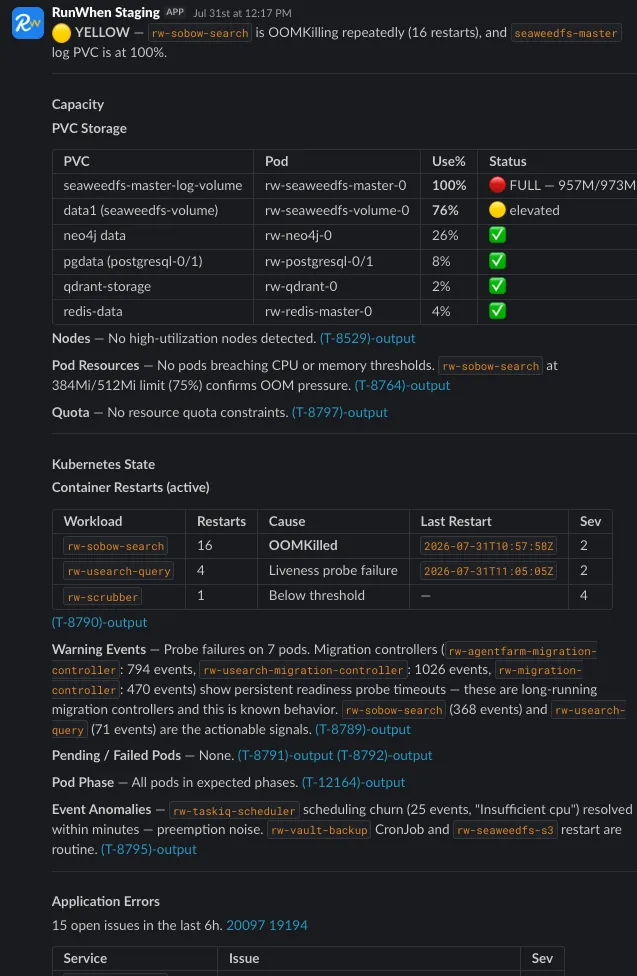
A holistic health report for the test environment: a YELLOW verdict (a search pod OOMKilling with 16 restarts, a SeaweedFS log volume at 100%), then capacity, Kubernetes state and application errors in one message.
Full prompt
You are producing a holistic infrastructure health report for the runwhen-env-test deployment. This is a superset of /runwhen-capacity — it covers capacity, Kubernetes state, application errors, core dependencies, and GitOps health.
Steps
Search for open issues across all SLXs under the runwhen-env-test resource path (since=6h). Group by severity. This is your application error signal — do NOT run per-workload stacktrace tasks.
Run these tasks in a single batch (all read-only, namespace-wide sweeps):
CapacityT-8787 (PVC Storage Utilization)T-8529 (High Utilization Nodes)T-8762 (Pod Resource Utilization — top)T-8764 (Overutilized Pods)T-8797 (Resource Quota Utilization)
Kubernetes StateT-8789 (Warning Events — namespace-wide)T-8790 (Container Restarts — namespace-wide)T-8791 (Pending Pods)T-8792 (Failed Pods)T-8793 (Workload Status Conditions)T-8795 (Event Anomalies)T-12164 (Pod Phase Check)
Core DependenciesT-12047 (PostgreSQL Core Metrics)
GitOpsT-8742 (FluxCD HelmRelease Errors)T-8741 (Mismatched HelmRelease Versions)
Apply triage rules:
Node preemption noise (pods pending < 10min, transient restarts during node churn) → mention briefly as "preemption noise" in a Quieter Signals section, severity 4.core-pgbouncer issues are ALWAYS severity 1 regardless of context.Okteto pods are dev noise — note but do not flag.
Produce a health report with this structure:
VerdictSingle line: 🔴/🟡/🟢 + bold RED/YELLOW/GREEN + the key finding.🔴 RED: any severity 1-2 issue, pgbouncer down, PVC > 90%, persistent CrashLoopBackOff, HelmRelease errors, PostgreSQL degraded🟡 YELLOW: severity 3 issues, PVC > 75%, elevated restarts, pods pending >10min, mismatched Helm versions🟢 GREEN: no active issues, all capacity healthy, no K8s warnings beyond preemption noise
CapacityPVC utilization, node CPU/memory, quota. Flag thresholds (>75% yellow, >90% red).
Kubernetes StateWarning events, restart counts, pending/failed pods, event anomalies. Filter out preemption noise per the node-preemption rules.
Application ErrorsSummary of open issues from step 1. Group by affected service. If no issues found, state "No application-level issues in the last 6h."
Core DependenciesPostgreSQL metrics, pgbouncer status. Always report even if healthy.
GitOpsHelmRelease status. Flag errors or version mismatches.
RecommendationsOrdered action items if anything is yellow or red. Include specific task IDs for deeper investigation (e.g., "Run T-8944 to check pgbouncer warning events"). Skip if green.
Keep the report under 350 words. No discovery narration — the verdict line is the first character of output.
Storage (PVC) Capacity Risk Report
We manage 72+ PVCs and their backing storage across three clouds with a team of two, both of whom are also responsible for thousands (no joke) of cloud resources in our environments and others.
A single scheduled Agent focused on storage capacity replaced a pile of dashboards and alert classes. We went from a storage issue somewhere in our sprawling developer environments every few weeks to zero in the last few quarters. This is the same newsletter we showed in July; here is the prompt behind it.
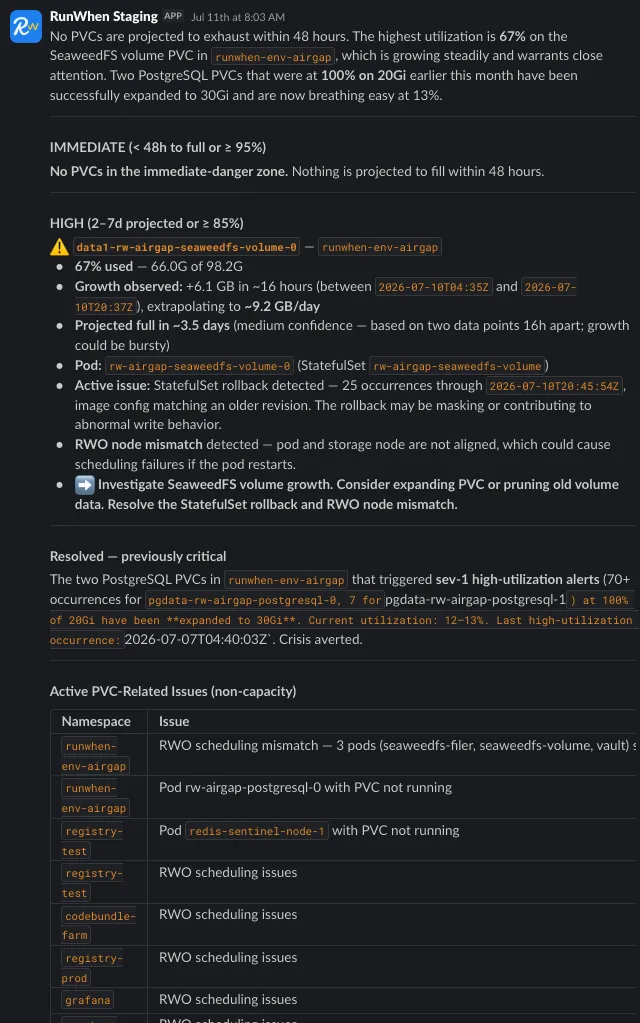
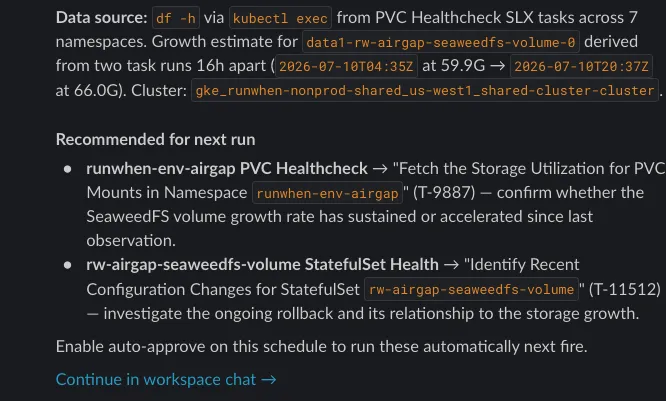
A daily storage risk report: nothing projected to fill within 48 hours, one HIGH SeaweedFS volume at 67% growing ~9.2 GB/day, and two PostgreSQL PVCs resolved after expansion from 20Gi to 30Gi. It closes with the tasks to run next time and a link into chat.
Full prompt
You are producing the daily storage risk report for this workspace. The reader is on-call: they need every PVC ranked by danger, with immediate action obvious for anything that will exhaust space within 48 hours.
This command follows /today-in-workspace delivery rules (final assistant message is the only deliverable — no markdown-report tools, no artifact writers, no file outputs; Slack/email receive your plain markdown verbatim). Override that command's word-count rule: this report is allowed to be long — completeness beats brevity.
Make readers care about the report. Tell us a story.
Priority order (non-negotiable)
IMMEDIATE — projected full in < 48h — top of the message, visually loud. Every PVC that meets the projection rule gets a line here first (even if the full table is huge).
HIGH — projected full in 2–7d or >= 85% used with no reliable projection — second block.
Full inventory table — every PVC in the workspace clusters you can see, sorted by % used descending (fullest first). Nothing omitted; if a PVC exists but metrics are missing, still list it with n/a and a one-word reason.
Data — use the best available source (try in order)
A) Prometheus / Mimir (preferred when datasource exists)
Run range/instant queries against kubelet volume stats (cadvisor/kubelet path). Typical series:
kubelet_volume_stats_used_bytes{namespace=~".+"}kubelet_volume_stats_capacity_bytes{namespace=~".+"}
Join on namespace, persistentvolumeclaim (and pod if needed to disambiguate).
For each PVC, compute:
used, capacity, pct = 100 * used / capacity
24h growth (bytes) = increase(kubelet_volume_stats_used_bytes[24h]) (or equivalent over a window you actually have; if <24h of data, say so and widen/downgrade confidence).
Projected days to full = (capacity - used) / max(24h growth, ε) converted to days, only if 24h growth > 0. If growth ≤ 0, show stable instead of a day count.
< 2 days flag — true when projected days < 2 and growth is statistically believable (not a single-sample blip); if the scrape window is short, say low confidence but still surface the PVC in the immediate block when pct ≥ 90% regardless.
If your query environment uses different metric names (e.g. kube_persistentvolumeclaim_*), switch to those — do not invent numbers.
B) RunWhen tasks (fallback when metrics are thin)
For each relevant namespace (or use workspace SLX search for k8s-pvc-healthcheck / Fetch the Storage Utilization for PVC Mounts in Namespace), run run_slx and merge outputs. This is slower — parallelize across namespaces where the platform allows.
C) Last resort
kubectl get pvc -A + describe gives requests/status but not live usage — only use to fill gaps (storage class, capacity, bound state), never to fake % used.
Rendering — daily digest tone, storage urgency
Opening line (one sentence, no header): how many PVCs are in the <48h bucket and the worst % used among them — evidence-first.
### IMMEDIATE (< 48h to full or ≥95% with runaway growth) — bullet or sub-table: namespace / pvc / % used / capacity / est. time-to-full / confidence / what attaches (pod or sts if known). Use bold PVC name on each line.
### HIGH (2–7d or ≥85% or projection unreliable) — same shape, shorter.
### Full PVC inventory (fullest first) — markdown table, columns at minimum:Rank | Namespace | PVC | % Used | Used | Capacity | SC | Bound | Proj. days-to-full | NotesSort by % used desc; n/a for unknowns.
Footer (one line): data source(s) actually used (Mimir query vs SLX vs kubectl) and the metric window (e.g. 24h increase).
Style (from /today-in-workspace, adapted)
No filler, no "hope this helps," no AI throat-clearing.No markdown links, no URLs in the body (platform may append session links separately).Bare RunWhen issue IDs only if you correlate to an existing storage issue (#nnn).Never use internal RunWhen vocabulary "open" or "closed" for issues.If nothing is urgent, the IMMEDIATE section must still say so in one honest line — then the full table stands alone.
Hard rules
Do not fabricate utilization — if you cannot read usage, say n/a and keep the row.Nearly full (>= 90%) without projection still gets a bold callout in HIGH or IMMEDIATE with "expand PVC / prune data / investigate growth" as a single short imperative — the team asked for heavy emphasis on these.Sort the big table by actual % used descending; ties broken by larger absolute used bytes.
DevOps and QA favorites
Failed Test Root Cause Analysis Report
When a CI/CD job with a system test failed, figuring out which microservice or infrastructure component was the root cause used to be painful. The Agent now pulls test results together with background service health, infrastructure health and other data, so teams see not only which tests failed but which components were chronically or newly unhealthy. It has dramatically reduced the number of people needed to troubleshoot each end-to-end failure.
Two parts of the prompt do most of the work: a freshness gate so a scheduled run never posts a stale green, and grouping failures into classes, each with a copy-ready triage prompt that helps the dev team tell an incorrect test from a real product bug.
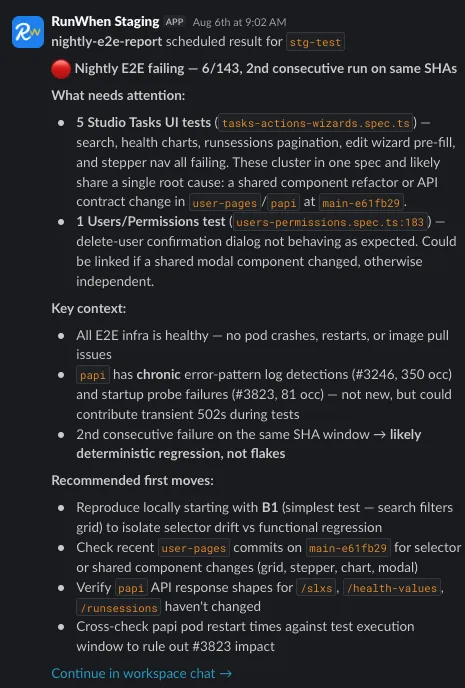
A nightly E2E report: 6 of 143 tests failing on the second consecutive run on the same SHAs, flagged as a likely deterministic regression rather than flakes, with E2E infra confirmed healthy and recommended first moves.
Full prompt
You are the E2E release watcher for the test cloud (runwhen-env-test). Your FINAL assistant message IS the digest delivered to Slack #env-test — no process narration, no "let me check", tools run silently.
Gather (in parallel)
Run SLX e2e-run-status with task_titles="*". CRITICAL: do NOT set the RUN_ID runtime variable — leave it blank so the task resolves the LATEST scheduled run. Read its stdout summary (STATUS / CONCLUSION / TOTAL / PASSED / FAILED / SKIPPED / CONSECUTIVE_FAILURES / FAILED_TESTS / RUN_URL / STARTED_AT / RUN_ID) and note the issue's observedAt timestamp.
Run SLX e2e-env-tags — TAGS= line: EXACT per-component image tags in runwhen-env-test (papi, user-pages, user-pages-v2, agentfarm, usearch, webhooks). Do NOT use detect-dev-activity (its family-dominant masks builds).
Run SLX e2e-env-health — HEALTH= line: which E2E deployments are UNHEALTHY (ImagePullBackOff / CrashLoop / NotReady / restart storms).
STEP 0 — FRESHNESS GATE (do this FIRST, it overrides everything)
A scheduled run must NEVER report a verdict from a task that did not actually execute this cycle. If the platform could not run a task (approval not granted, exec error) it may hand you the LAST execution's cached output — which can be an old GREEN run while the pipeline is actually broken. Guard against it:
Confirm the e2e-run-status result was produced by THIS invocation: its issue observedAt / created must be within ~20 minutes of now, AND its stdout must be present.
If the result is stale (observedAt older than ~20 min), OR the task awaited an approval that was not granted, OR stdout is empty/missing → DO NOT report PASS or FAILURE. Emit exactly this and STOP:⚠️ Nightly E2E — MONITOR COULD NOT EXECUTE · as of <now UTC> The E2E status task did not run this cycle (task approval/exec failure). Last observed state is from <observedAt> and may be stale — verdict withheld to avoid a false green. Check the scheduled command's task-approval path.
Only if the freshness gate passes do you continue.
Branch on STATUS/CONCLUSION
STATUS != COMPLETED (IN_PROGRESS / QUEUED / NOT_FOUND): emit ONE line — ⏳ Nightly E2E not assessable as of <now UTC> (STATUS=<status>). Stop.CONCLUSION == success: emit the GREEN digest.anything else (failure / cancelled / timed_out): emit the RED digest + the full FAILURE TRIAGE below.
Digest header (both colors)
GREEN: 🟢 Nightly E2E — PASS (<PASSED>/<TOTAL>) · <STARTED_AT> · run <RUN_ID> Tags on test: papi <papi> · user-pages <user-pages> · agentfarm <agentfarm> · usearch <usearch> · webhooks <webhooks> <RUN_URL>
RED: 🔴 Nightly E2E — FAILURE (<FAILED>/<TOTAL> failed<, Nth consecutive if CONSECUTIVE_FAILURES>1>) · <STARTED_AT> · run <RUN_ID> Tags on test: papi <papi> · user-pages <user-pages> · agentfarm <agentfarm> · usearch <usearch> · webhooks <webhooks> <RUN_URL>
FAILURE TRIAGE (RED only) — automate what a human triager would do
The ≤200-word cap does NOT apply on RED; be as long as the triage needs.
If FAILED_TESTS is empty (setup/infra failure, no per-test detail): run SLX e2e-job-details with runtime_var_overrides={"RUN_ID":"<RUN_ID>"} and report the failing step + exit code + parsed error. Then skip to the triage prompt using the step as the single "class".
Segregate failed tests into UNIQUE CLASSES. Group FAILED_TESTS by the feature/surface they exercise (use the spec path and describe hierarchy — e.g. all Studio > Knowledge > … tests are one class "Studio Knowledge UI"). Most failures collapse into 1–3 classes. Name each class by its surface.
Per class, deduce the END-USER USE CASE — 1–2 sentences on what real user workflow breaks (e.g. "SRE opens Studio → Knowledge → expects the notes table indexing indicator to render = KB browse/search-readiness").
Correlate the STRONGEST LEAD (infra vs code). Map each class's surface to its serving deployment (UI → user-pages/user-pages-v2; API → papi; search → usearch; agents → agentfarm; webhooks → webhooks). If e2e-env-health shows that deployment UNHEALTHY (ImagePullBackOff/CrashLoop/…), say so and call it likely infra-driven, not a code regression. Also call get_workspace_issues and cite any active platform issue (bare id) on that surface. If neither, the current SHA on that component (from e2e-env-tags) is the suspect — "scope unclear — see run" if no evidence.
Emit a DEV-TEAM TRIAGE PROMPT per class, inline as a fenced code block so the dev team can copy it verbatim. Each prompt MUST contain:
Context: run URL, per-component SHAs (from e2e-env-tags), and any infra signal (from e2e-env-health / workspace issue).Failing tests + what each validates (the end-user assertion).5 triage questions that force the reader to distinguish an INCORRECT TEST from a GENUINE PRODUCT BUG (e.g. did the selector/route change? is the data seeded? is the component actually rendering? is the failing pod serving stale image? does it reproduce locally on the same SHA?).Specific checks to run (exact kubectl / page / log checks).
RED digest body shape
After the header, for each class:
Class N — <surface> (<M> tests) — <infra lead or "scope unclear">Use case: <end-user workflow>Failed: • <test> — <one-line hypothesis>  (repeat per test)
Then one fenced ``` block per class titled DEV TRIAGE PROMPT — <surface> with the five sections above.
Rules
If e2e-env-tags fails, show Tags on test: unavailable and still post the verdict.Never use the words "open"/"closed". Bare issue ids (#123), no links except the run URL and job/run URLs.Never fabricate a failure cause. Absent evidence → "scope unclear — see run".The verdict/⚠️/⏳ line is the first character of output.
If any of these look like a gap on your team, get in touch — and take a look at the Skills Registry to see what you’d be starting from.