Rotating a TLS Cert? Remember to Move Your Grafana Datasource Versions Forward
A TLS and false-positive alert story.
TL;DR
When you rotate a TLS cert that a Grafana provisioned datasource depends on, also bump the version field in the datasource YAML. Grafana caches the datasource config — TLS material included — in its PostgreSQL data_source table, and only re-reads the on-disk file when version changes. Skip the bump and Grafana silently keeps using the old cached cert, even after a restart. Equivalent fix without a YAML edit: PUT the new cert via /api/datasources/name/<datasource>.
If you came here for that, you can stop. If you’d rather skip the story and see the long-term fix, jump to the daily task that catches this drift before the alert fires. Otherwise read on — the rest is the false-positive alert that surfaced this, and how the agent walked us back to the real cause.
Prologue
Twice a year you move your clocks forward (or back), and most of the time you remember. The times you forget, you find out the hard way. Grafana provisioned datasources have an equivalent ritual: after you rotate the TLS cert behind one, you also have to nudge the integer in the datasource YAML’s version field forward. The cert file on disk updates, the rotation log is clean — but Grafana itself won’t reload the new cert until that one number ticks up.
We forgot. The signal arrived as a noisy alert in our Grafana alerts channel — nominally about container OOM events, with Value: [no value] on it and an x509 expiry buried in the annotation. Instead of pulling a couple of us into the thread to debate, we handed it straight to the RunWhen Agent. What follows is what it surfaced, and the daily task we wrote afterwards so the next person on rotation doesn’t chase it from a misleading symptom.
Act I — “Is this valid?”
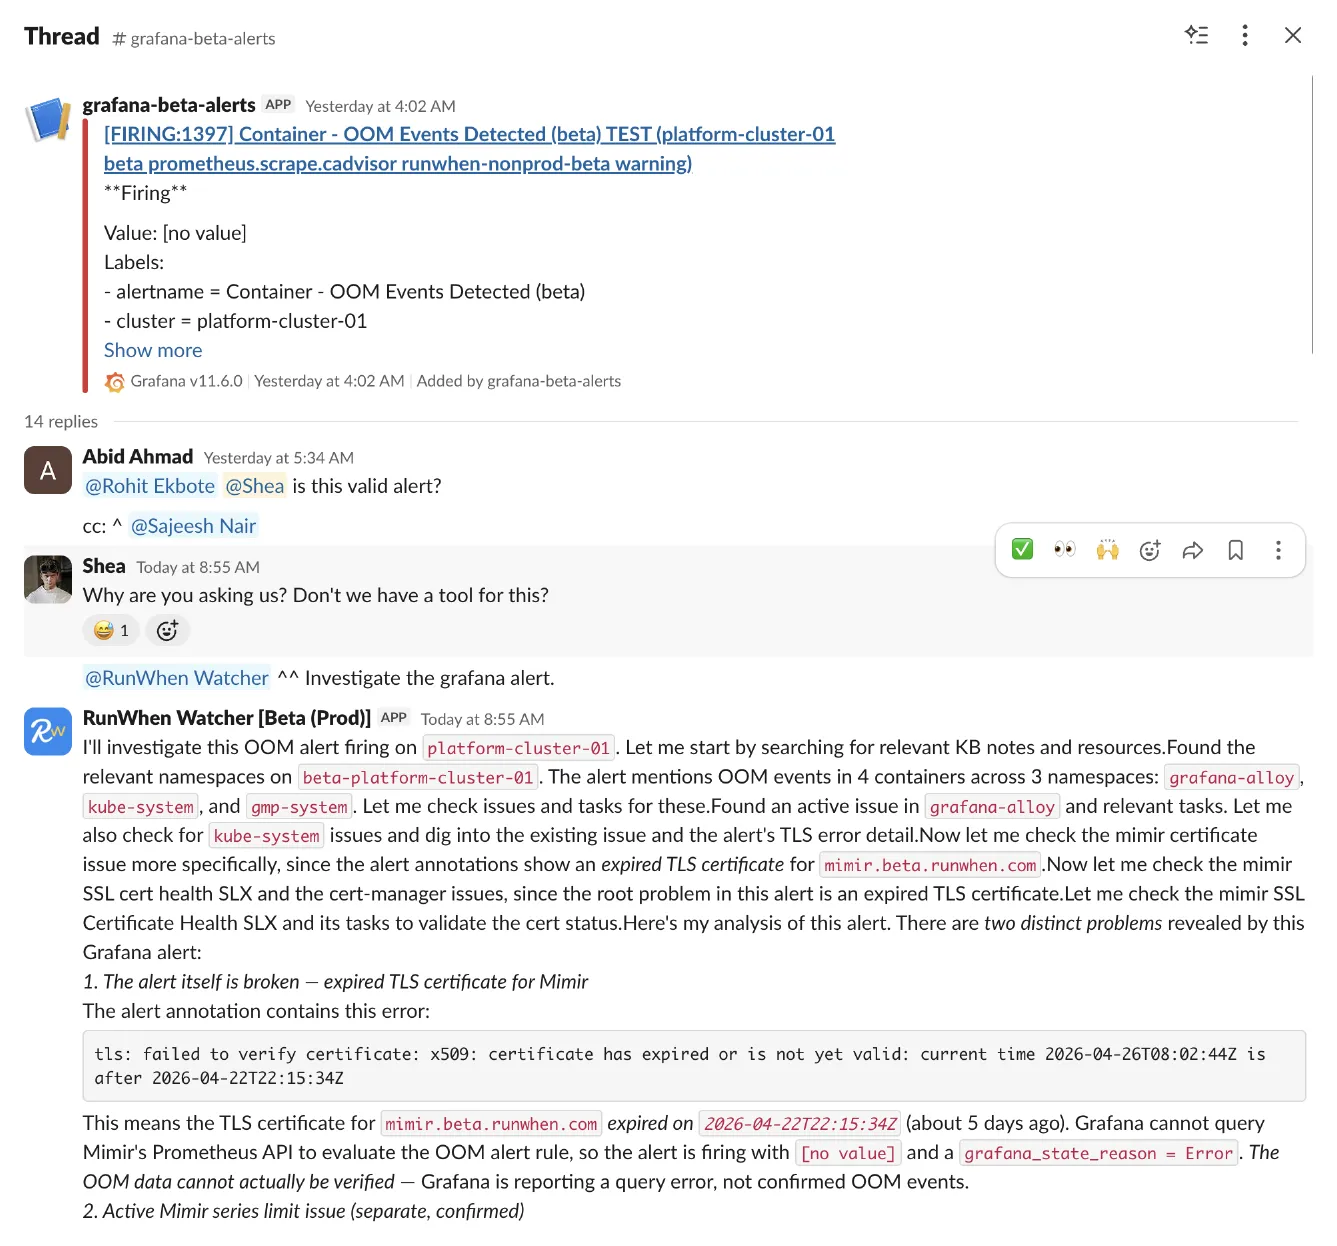
The alert headline pointed at four containers in three namespaces and a memory-pressure story that, taken at face value, would have eaten the morning. The agent read the annotation block before the headline:
tls: failed to verify certificate: x509: certificate has expiredor is not yet valid: current time 2026-04-26T08:02:44Z is after2026-04-22T22:15:34ZThat single line reframes the rest of the alert. Grafana can’t query Mimir’s Prometheus API, so the alert rule evaluates with no data and fires with grafana_state_reason = Error. The headline isn’t a finding — it’s a query failure dressed up as one.
The agent also flagged a separate, real problem in the same sweep: a high-severity issue with hundreds of occurrences where grafana-alloy-metrics is exceeding Mimir’s 500k per-user series limit on one of the tenants. Worth fixing — unrelated to the alert in this thread.
Act II — Run the cert checks from the thread
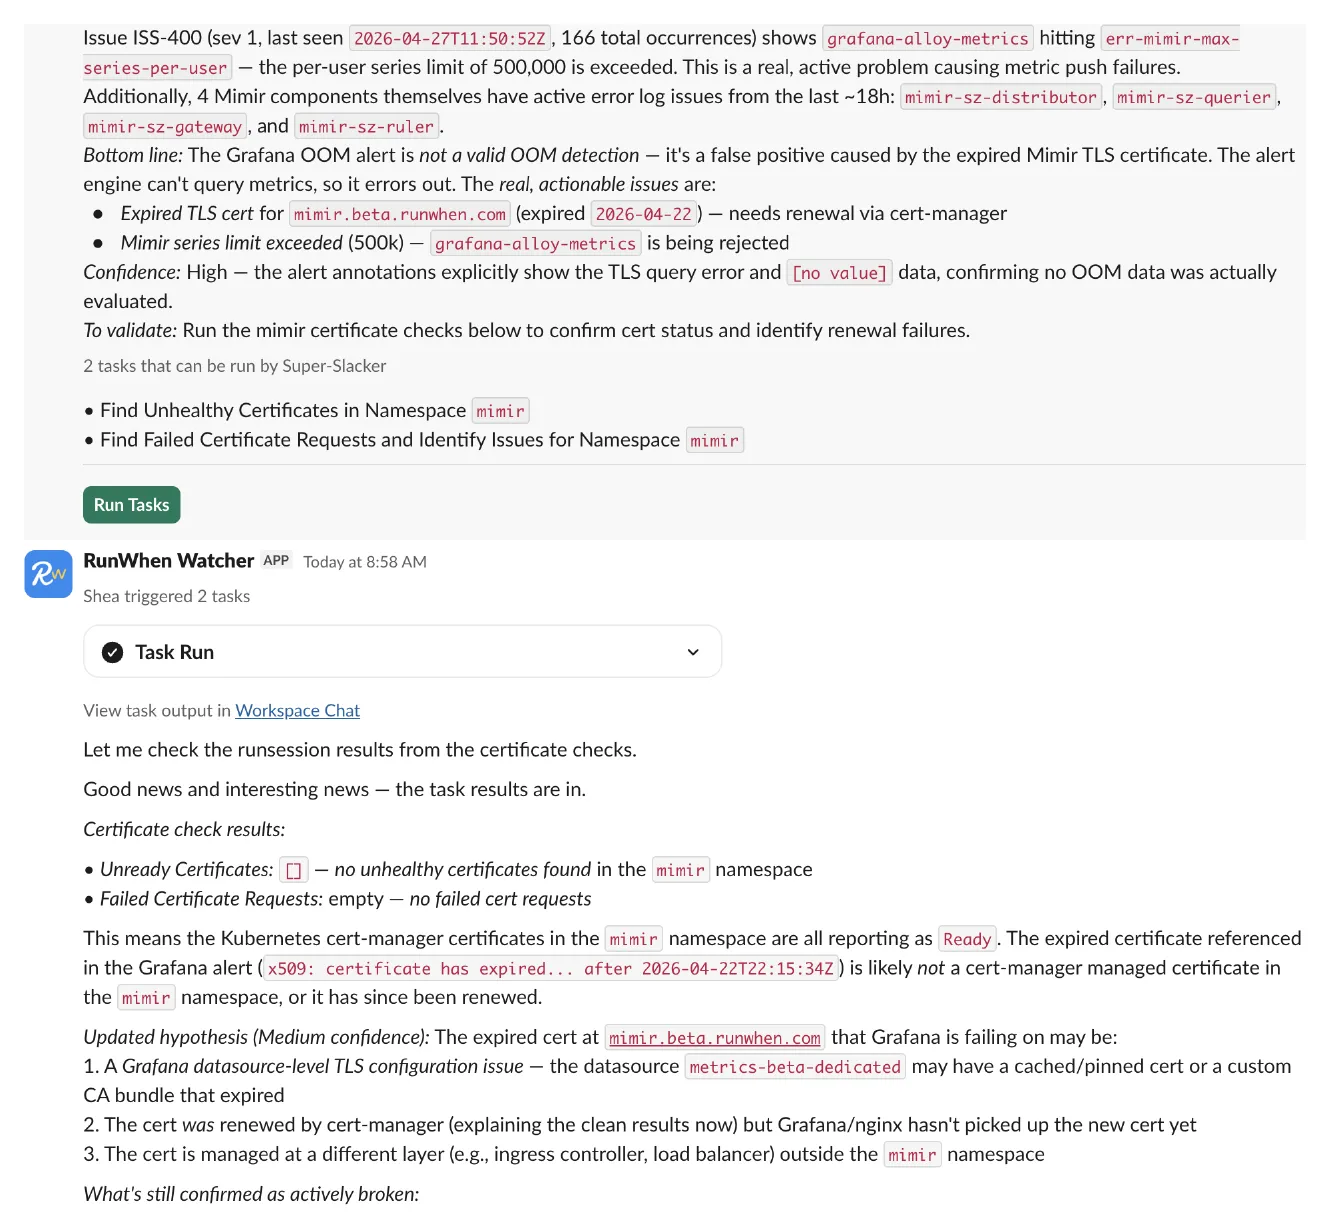
The agent’s recommendation: two existing tasks against the mimir namespace — Find Unhealthy Certificates and Find Failed Certificate Requests and Identify Issues. We triggered both from the thread.
Both came back clean: Unready Certificates: [], no failed cert requests. Every cert-manager-managed leaf certificate in mimir was Ready. The cert in the alert annotation isn’t a leaf cert and isn’t in the namespace those tasks scanned.
The failure is somewhere between cert-manager and the thing actually doing the TLS handshake — Grafana, in the shared cluster, querying Mimir over the public endpoint in another cluster.
Act III — The CA, not the leaves
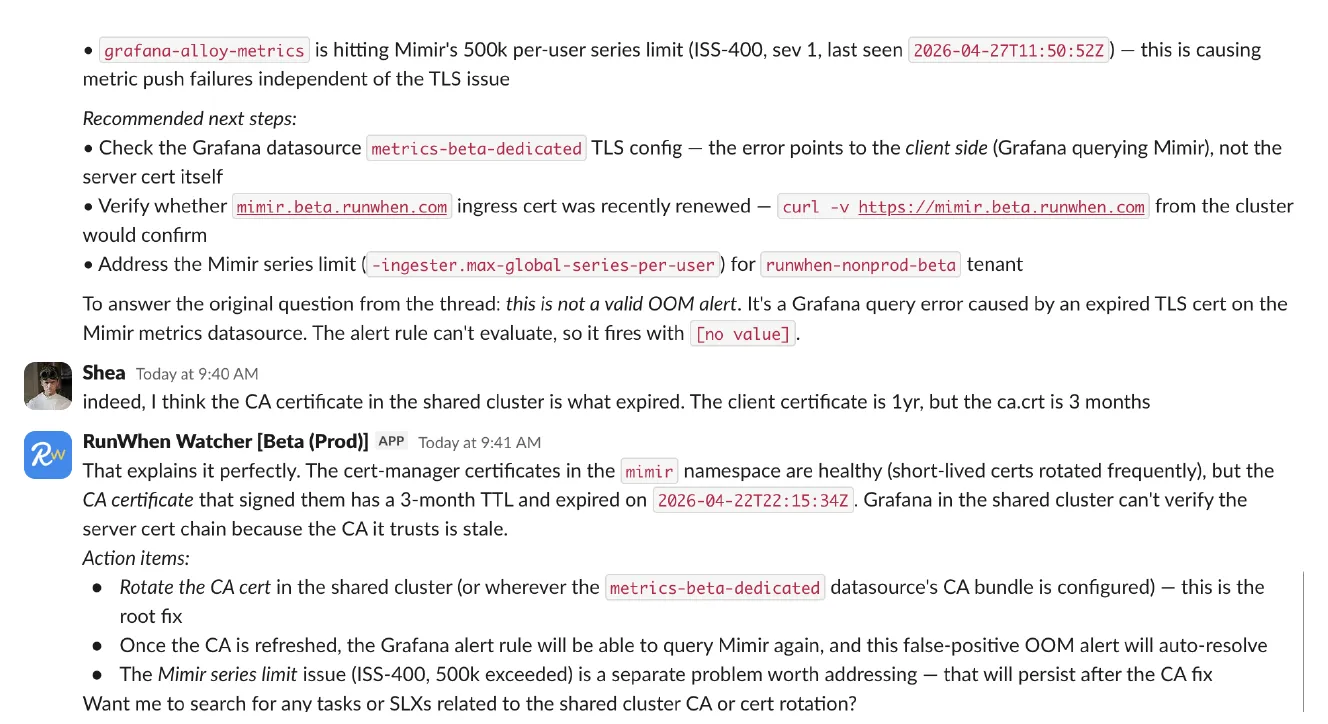
The cert-manager-managed leaf certs in mimir rotate frequently and were all green. The CA that signs them, in the shared cluster, has a 3-month TTL. Different rotation schedule, different surface. The CA expired on 2026-04-22T22:15:34Z — exactly the timestamp in the alert annotation — and Grafana in the shared cluster, which trusts that CA in the datasource bundle, immediately stopped being able to verify the chain Mimir presented.
The alert wasn’t lying about when. It was lying about what — a container-level headline pointing at a CA cert two clusters away.
”I rotated and restarted, and it’s still broken”
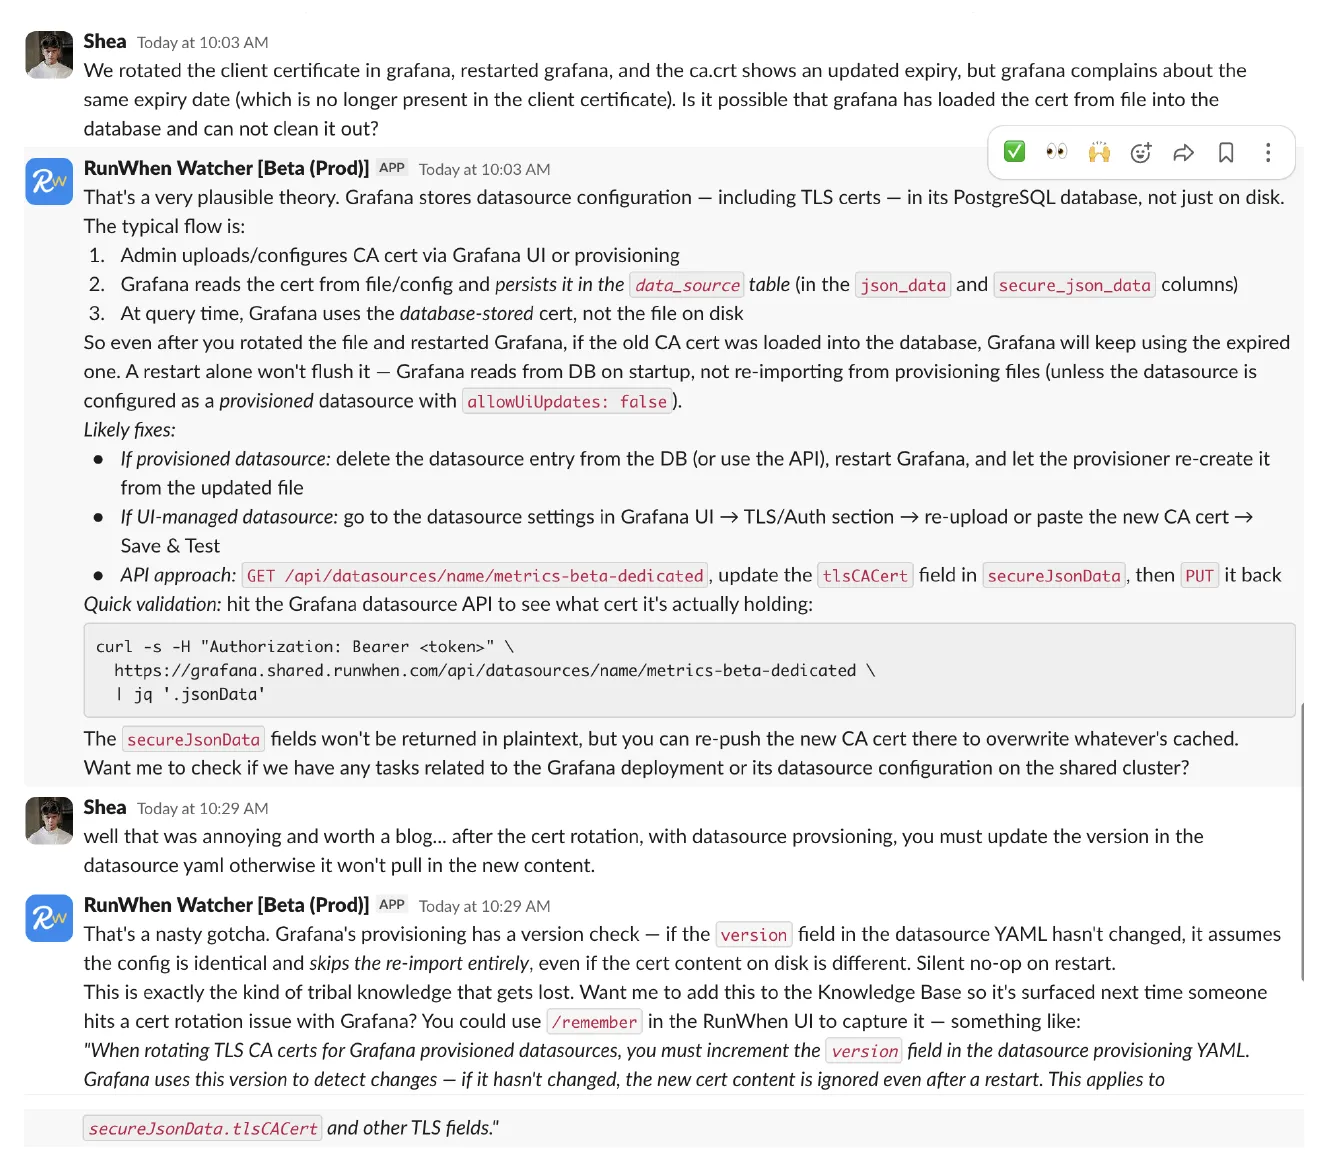
Rotating the CA on disk and restarting Grafana didn’t fix it. The pod came up clean, ca.crt on the volume showed the new expiry, and Grafana kept reporting the old one — a date that no longer existed in any file we could find.
Grafana stores provisioned datasource TLS config in its PostgreSQL data_source table (json_data and secure_json_data). On startup it reads from the database, not from the provisioning YAML. The file on disk is consulted only when the provisioner decides it’s new — and the provisioner’s definition of “new” is: the integer in the version field changed.
Bump the cert content but leave version: 1? Silent no-op on restart. Grafana keeps using the cached tlsCACert from secure_json_data, and the same expiry date keeps showing up in error logs after every rollout.
Bumping version (or pushing the new cert via PUT /api/datasources/name/<datasource>) is what unsticks it.
The whole arc, in four steps:
- Misleading alert fires → actually a TLS cert expiry
- CA cert rotated → Grafana still broken (DB cache)
- Grafana restarted → still broken (provisioning version check)
versionbumped → finally picks up the new cert
Three “I fixed it but it’s still broken” layers before the real fix landed. None of them visible from the alert text.
Act IV — Closing the loop
The fix on the day was manual: rotate the cert, bump the integer, restart the pod. What we owed ourselves was a daily check that would have caught it before the alert ever fired. cert-manager doesn’t refresh ca.crt on a leaf Secret just because the upstream CA changed, so the only place the drift is visible is at the source — in the destination cluster, beside the workload that issued it.
We wrote one task per environment that runs on a daily cron 30 days ahead of expiry. Each task reads the client cert in its destination cluster and decides whether either side is close enough to expiry to act. If so, it forces a re-issue at the source, mirrors the new material back to the shared cluster, and opens a PR that bumps the affected datasource versions.
We didn’t sit down and hand-write the script. The requirements went to a coding agent connected to this workspace via the RunWhen Platform MCP server — the same tool we covered in From Laptop to Production Ops in One Prompt. The agent authored the Python, validated it against the contract, ran it against live infrastructure to confirm the cert mirror and the PR open cleanly, and committed it as one task per environment. The prompt was roughly:
Build a daily check, one task per destination cluster, thatcompares the Grafana client TLS cert in the destination's mimirnamespace against its mirror in the shared cluster's grafananamespace. If ca.crt or tls.crt is within 30 days of expiring,force a re-issue at the source, mirror the fresh material intoshared, and open a PR that bumps the version integer on everyGrafana datasource referencing the cert. Use a GitHub App for thePR so no PAT lives in the workspace secrets.The MCP server is what gives the agent the same view of the workspace the rest of our operational tooling has — so it can author against it, test against it, and commit into it without us hand-rolling auth, secret plumbing, or runbook scaffolding.

One non-obvious detail: force re-issue by deleting the Secret, not the Certificate. Deleting the cert-manager Certificate CR loses the race against Flux re-applying it; cert-manager sees the still-valid leaf Secret it owned and adopts it again, leaving the stale ca.crt in place. Deleting the Secret leaves the Certificate intact but with nothing to reference, and cert-manager issues a fresh leaf from the current CA chain. That’s the path we used to pick up a rotated CA on a leaf that still has time on it.
After the PR merges, Grafana still has to be restarted to pick up the new cert. We rely on the natural restart cadence — preempt cycles, GKE auto-upgrades, unrelated Deployment reconciles — which lands well inside the 30-day buffer the task triggers on.
The result is that the workflow shows up in the same place every other piece of operational automation in this workspace lives — askable, runnable, and unsurprising. Asking the assistant for it returns the tasks themselves:
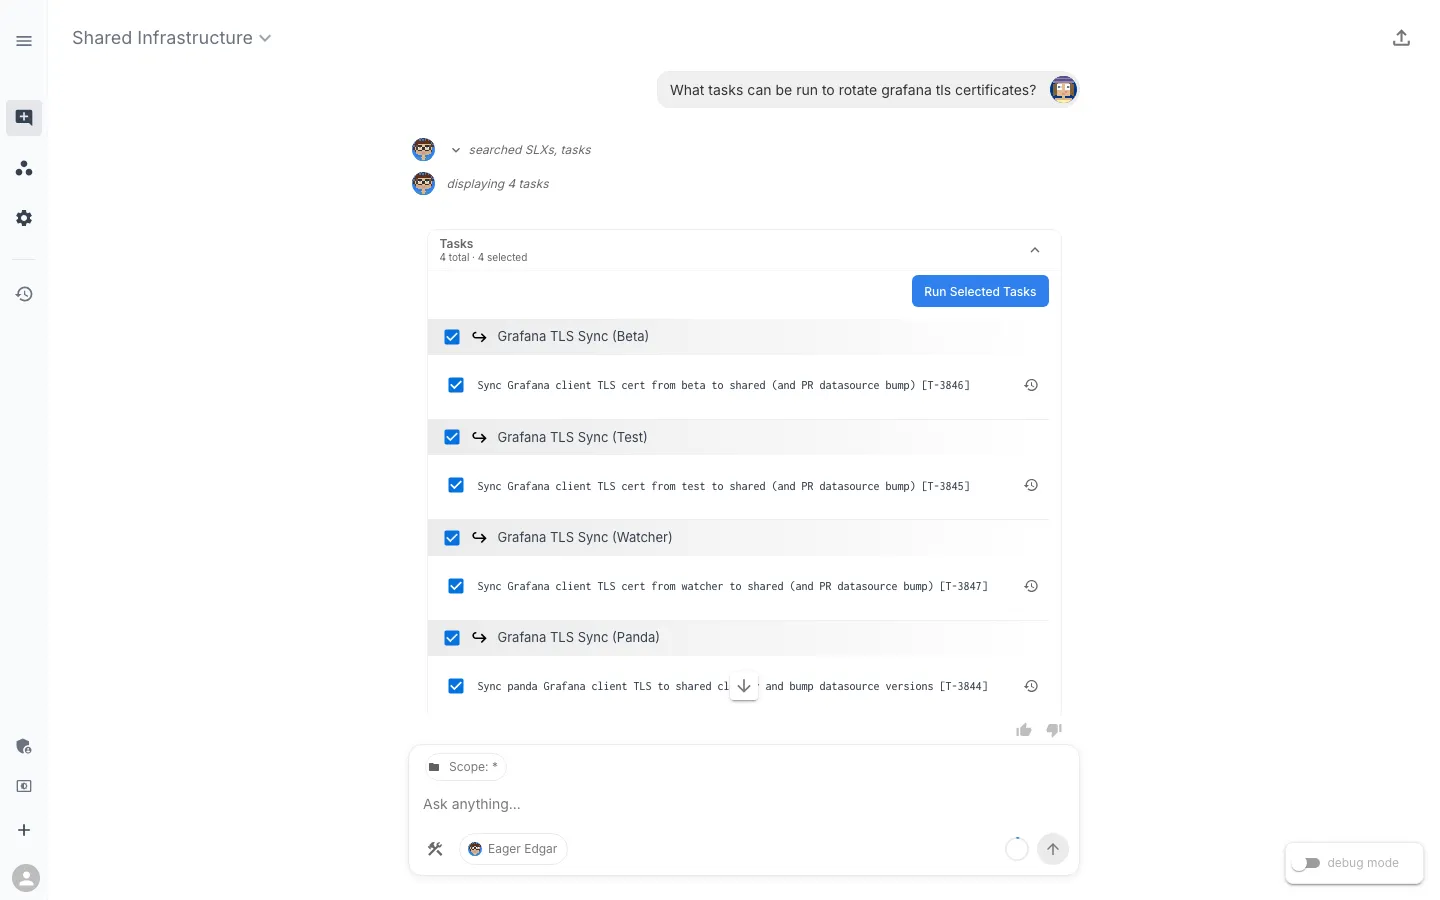
Selecting one and running it returns the result inline:
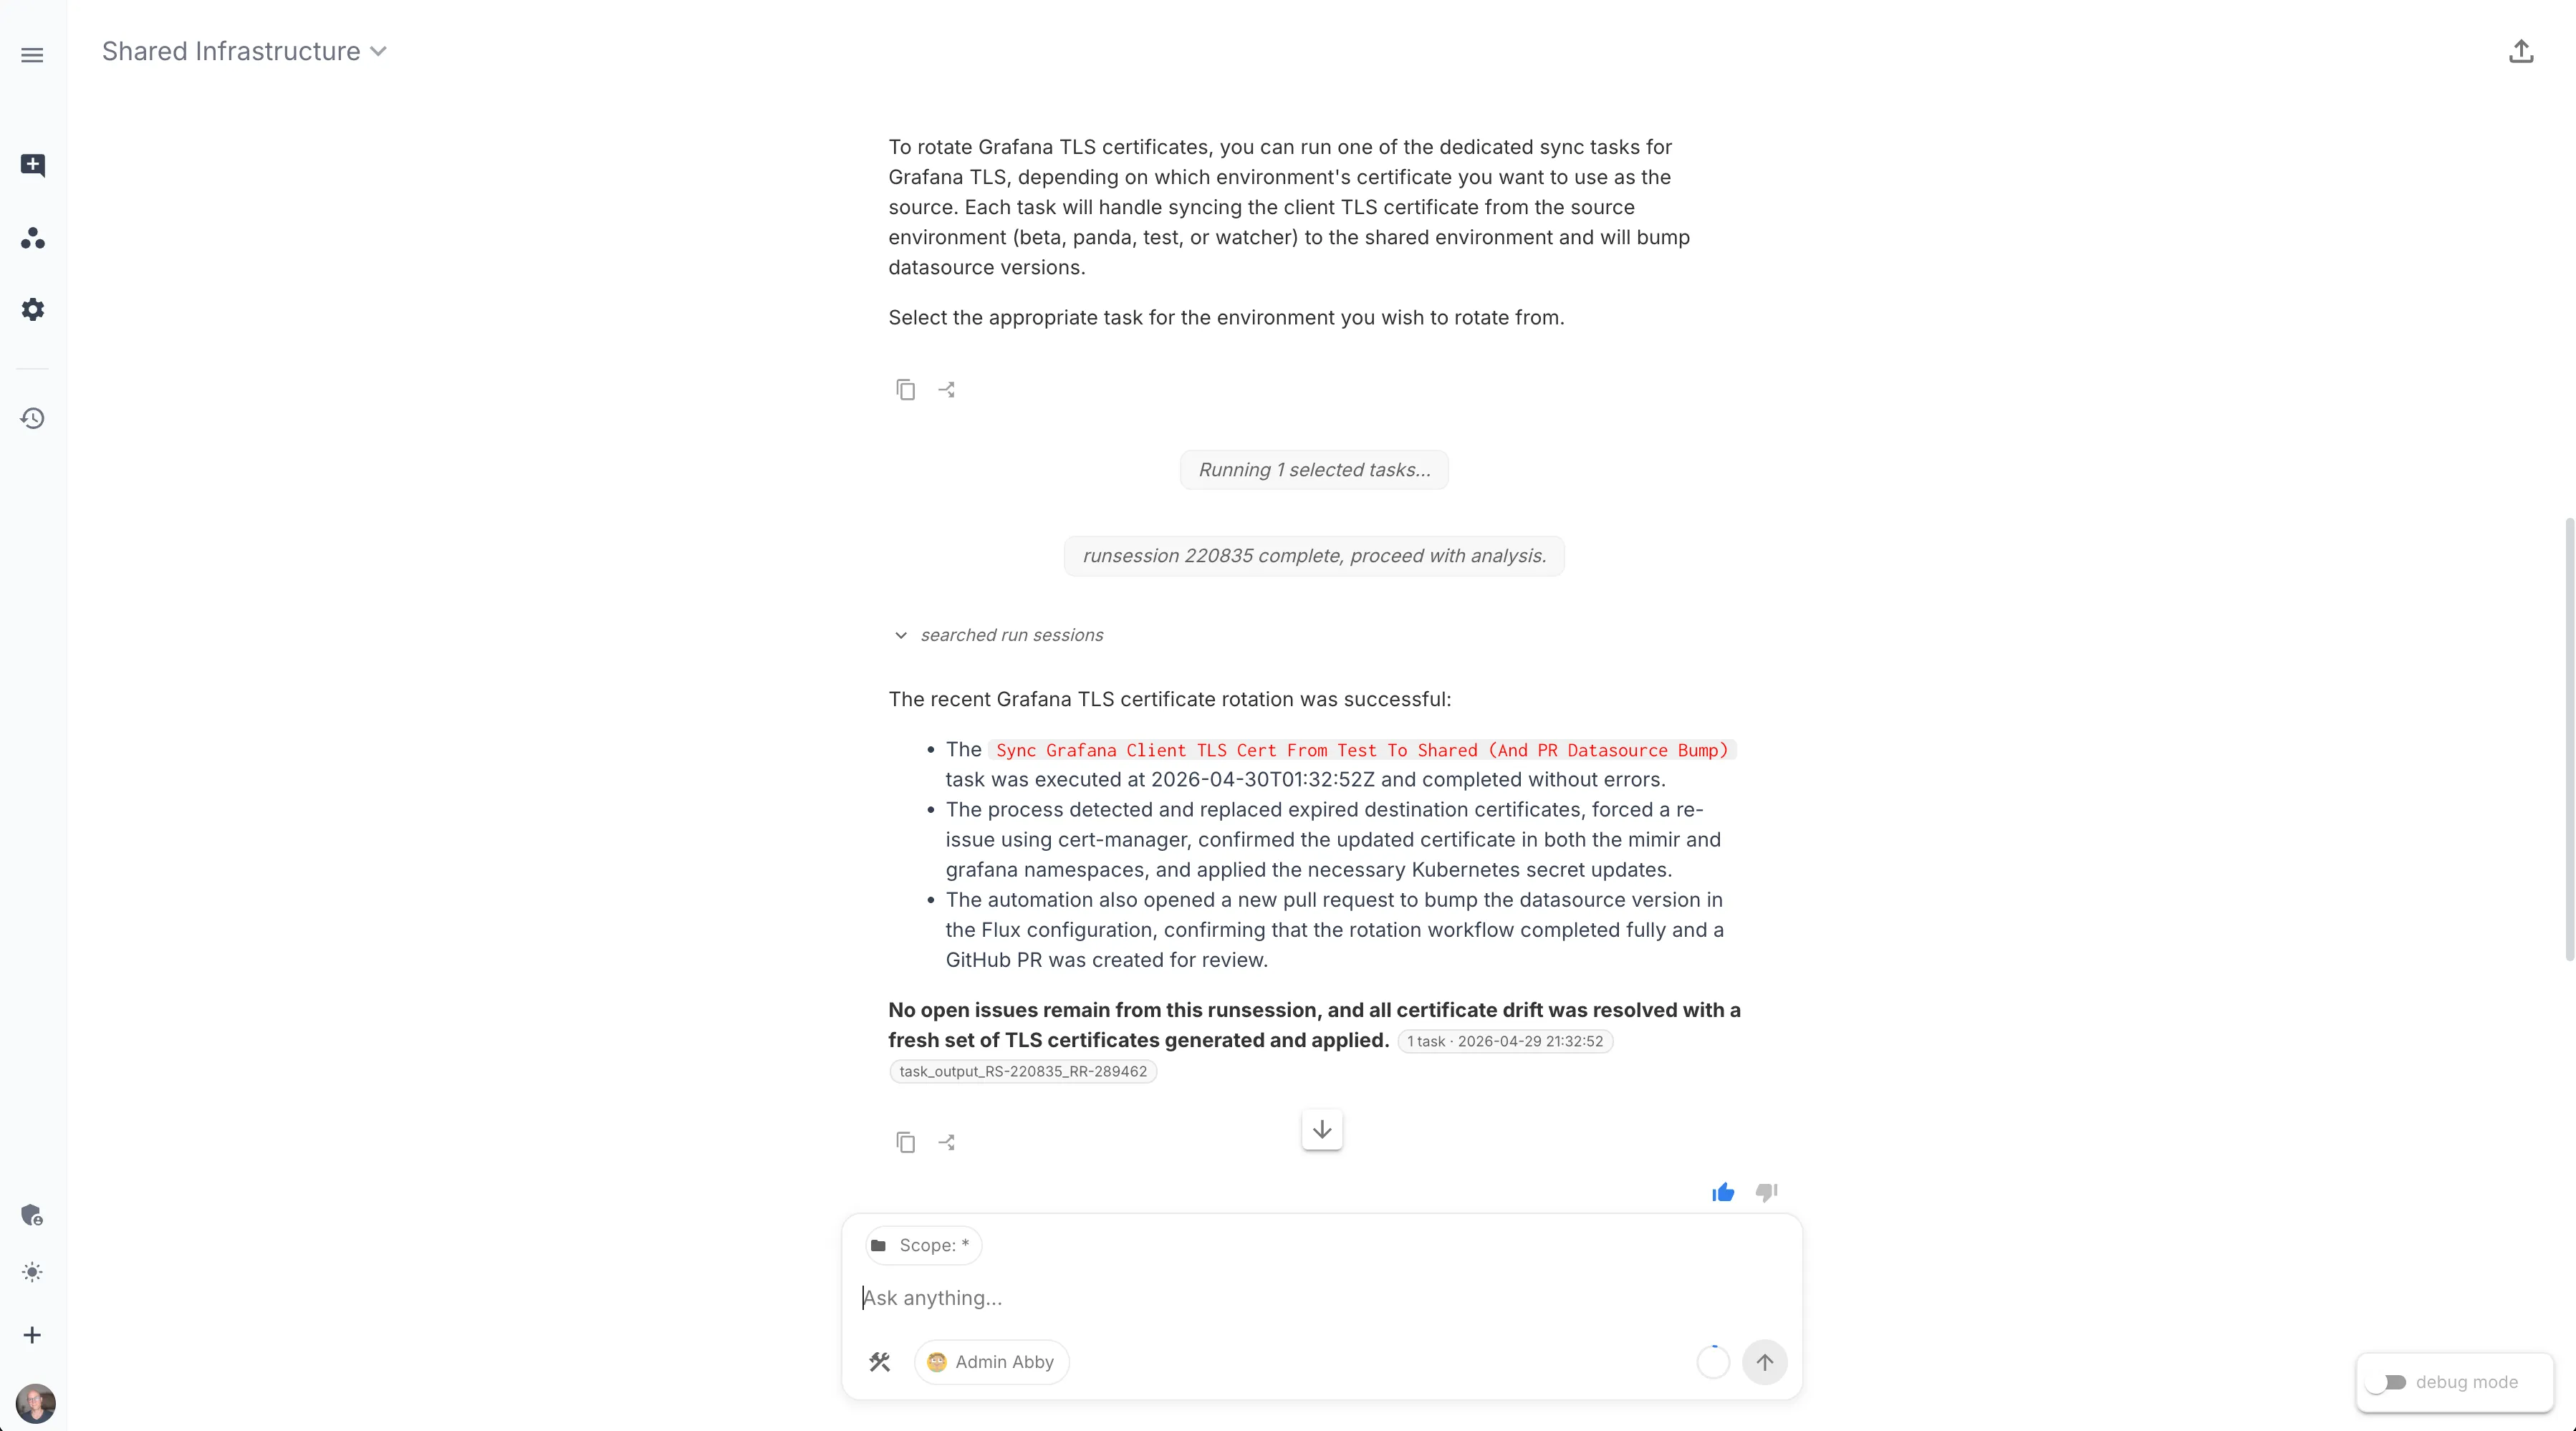
Three layers of “I fixed it but it’s still broken” is the price we paid for not having this task. The next time the CA rotates we’ll see the PR before we see the alert — and the lesson, instead of living in a Slack thread someone has to remember to read, runs every morning. That’s the version of operational learning we want: not a wiki page, not a Slack pin, but a task that fires whether anyone is watching or not.
If your stack has a similar gotcha — a piece of provisioned config that needs a nudge after a rotation, a credential whose drift only shows up two layers downstream, a manual step that everyone agrees should be automated “next quarter” — the prompt above is a reasonable starting point. Point an MCP-connected agent at your workspace, describe the check, and let the same surface that triages your alerts author the fix.